
Description
Algorithme Intelligent de Suivi
https://chartshots.spotware.com/c/69f0f1d89000b
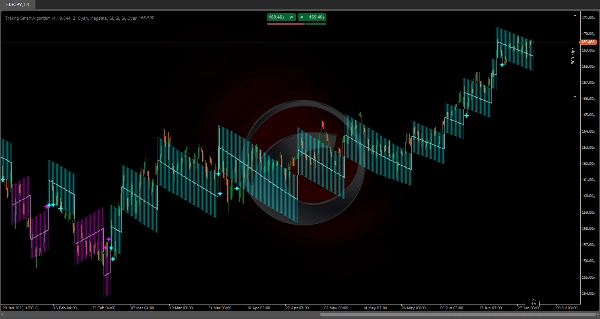
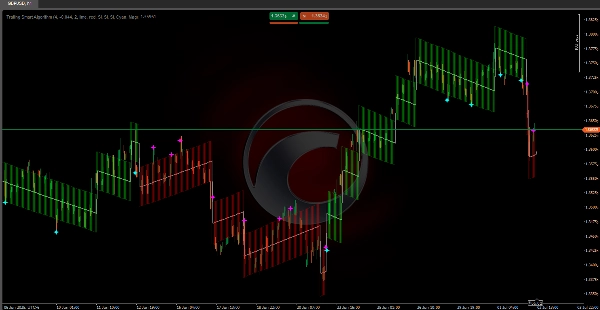
Incorpore des algorithmes mathématiques 🧠 spécialement conçus pour suivre constamment le prix dans toute condition de marché 🌐.
Sa structure de calcul garantit que la ligne de tendance reste toujours synchronisée avec les mouvements de prix, évitant le décalage typique des indicateurs traditionnels ⏳.
Contrairement aux algorithmes conventionnels, ce système utilise des mesures précises de volatilité 📊 et applique des ajustements automatiques ⚙️ garantissant un suivi optimal. Ses calculs internes sont conçus pour fournir une représentation précise de la direction du marché, maintenant la précision lors des mouvements rapides ⚡ et du développement progressif de la tendance 🕊️.
https://chartshots.spotware.com/c/69f0f218591b0
💡 Comment ça fonctionne ?
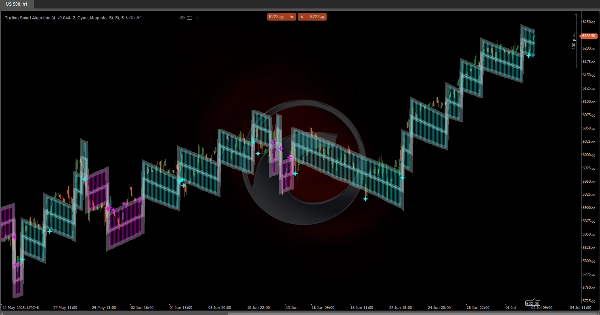
L'indicateur fonctionne avec un système de pas adaptatif qui se déplace dans la direction de la tendance dominante.
Il est basé sur trois composants principaux :
https://chartshots.spotware.com/c/69f0f2b19e4d3
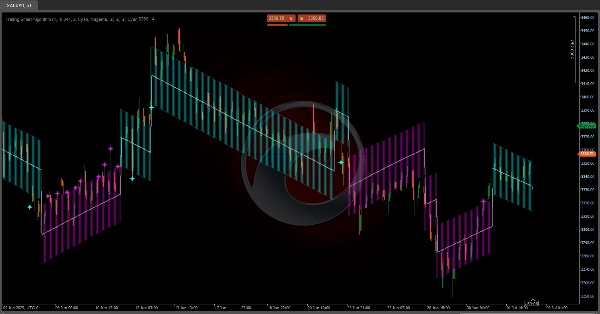
1️⃣ Détection de Changement de Tendance
Le système surveille en continu le prix pour détecter des mouvements significatifs dépassant un seuil spécifique (Déclencheur d'Impulsion 🎯).
Lorsque le prix s'éloigne suffisamment de la ligne de tendance actuelle, l'indicateur reconnaît un changement potentiel de direction et repositionne sa ligne principale.
2️⃣ Suivi Dynamique
Une fois la direction définie, la ligne de tendance se déplace pas à pas 🪜 dans la même direction que le marché.
Chaque pas est calculé en fonction de la volatilité actuelle (ATR 📈) :
• Dans les marchés plus volatils, les pas sont plus grands 🌊
• Dans les marchés plus calmes, les pas sont plus petits 🌿
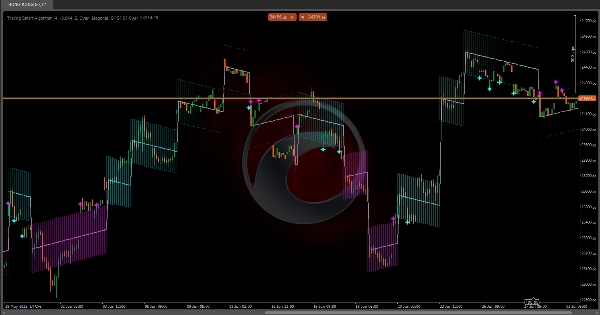
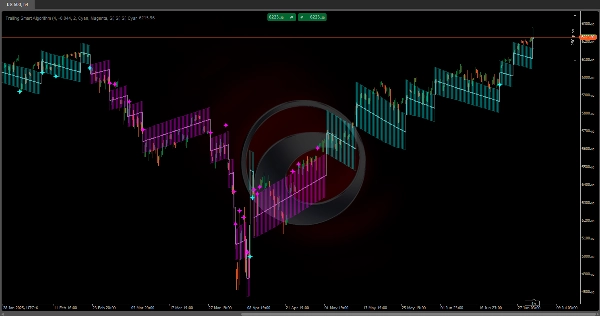
3️⃣ Canal de Volatilité
Un canal se forme autour de la ligne principale (bandes supérieure et inférieure) représentant la zone de volatilité normale 📉📈.
Ce canal aide à identifier si le prix se comporte dans des paramètres normaux ou effectue des mouvements extrêmes 🚨.
📏 Canal de Volatilité
• Bande Supérieure : Limite supérieure du canal de volatilité
• Bande Inférieure : Limite inférieure du canal de volatilité
✨ Signaux de Retest
• Étoiles Cyan 🌟 : Le prix touche ou franchit la bande inférieure lors d'une tendance haussière
• Étoiles Magenta ⭐ : Le prix touche ou franchit la bande supérieure lors d'une tendance baissière
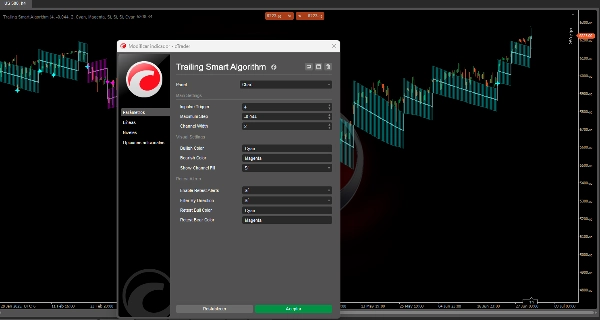
⚙️ Paramètres
🔹 Paramètres Principaux
Déclencheur d'Impulsion (valeur par défaut : 4)
À quoi ça sert ?
Détermine la sensibilité pour détecter les changements de tendance. C’est le multiplicateur ATR définissant combien le prix doit bouger pour déclencher un changement de direction.
Impact en cas de modification :
• Valeurs plus élevées (5–8) :
- Plus résistantes aux changements de tendance 🛡️
- Moins de faux signaux
- Réponse plus lente aux véritables changements
• Valeurs plus basses (2–3) :
- Sensibilité plus élevée 🎯
- Réaction plus rapide
- Plus susceptible de produire de faux signaux dans les marchés latéraux
Pas Maximum (valeur par défaut : -0.044)
À quoi ça sert ?
Limite la taille maximale de chaque pas que la ligne de tendance peut prendre. C’est une valeur négative agissant comme un plafond.
Impact en cas de modification :
• Moins négatif (-0.020 à -0.030) :
- Pas plus grands 🚀
- Suivi de tendance plus agressif
• Plus négatif (-0.050 à -0.080) :
- Pas plus petits, plus progressifs 🌱
- Suivi plus conservateur
Largeur du Canal (valeur par défaut : 2)
À quoi ça sert ?
Définit la largeur du canal de volatilité autour de la ligne principale.
Impact en cas de modification :
• Valeurs plus élevées (3–4) :
- Canal plus large 🟢
- Moins de signaux de retest
- Plus grande tolérance à la volatilité
• Valeurs plus basses (1–1.5) :
- Canal plus étroit 🔴
- Plus de signaux de retest
- Plus sensible au bruit
🎨 Paramètres Visuels
Couleur Haussière / Couleur Baissière
Définissent les couleurs pour les tendances haussières et baissières respectivement.
Afficher le Remplissage du Canal
Active ou désactive le remplissage visuel du canal de volatilité 🌈.
🔔 Paramètres de Retest
Activer les Alertes de Retest
Active ou désactive les signaux de retest lorsque le prix touche les bandes du canal.
Filtrer par Direction
Lorsqu'activé, affiche uniquement les signaux de retest correspondant à la tendance actuelle :
• En tendance haussière : uniquement les signaux sur la bande inférieure
• En tendance baissière : uniquement les signaux sur la bande supérieure
🌟 Récapitulatif des Signaux de Retest
• Étoile Cyan sur la Bande Inférieure : Rebond haussier potentiel depuis un support dynamique ✅
• Étoile Magenta sur la Bande Supérieure : Rebond baissier potentiel depuis une résistance dynamique ❌
Résumé
Avis clients
5 | 100 % | |
4 | 0 % | |
3 | 0 % | |
2 | 0 % | |
1 | 0 % |


![Logo de "High-Low Divergence [Iridio Capital]"](https://cdn.ctrader.com/image/webp/443c4661-7abb-40f1-842f-4b6ec560649b_40914)


