Açıklama
Pinescriptlabs Store göstergeleri: Pinescriptlabs Store cBotları : (cBot) Gold & BTC BreakoutOturum Pivotları(yeni)
Gelişmiş Piyasa Yapısı: Bos, Choch, SwinLevels, Emir Blokları, Piyasa Yapısı & Likidite Bulucu (Yeni)
ZigZag Fiyat Likidite Projeksiyonu
Takip Eden Akıllı Algoritma (yeni)
AkıllıTrend Destek &
Direnç
Çizgileri
Dinamik
Piyasa Yapısı
Analizi
Dönüş
Noktaları
Fibonacci
Doğrusal
Regresyon
Çok Zamanlı
Çok Katmanlı
Mum Eğilimi
Takipçisi
Otomatik
Destek ve
Direnç
Trend
Çizgileri
Tüm
Destek ve
Direnç
Seviyeleri
Bölgeler Arz & Talep
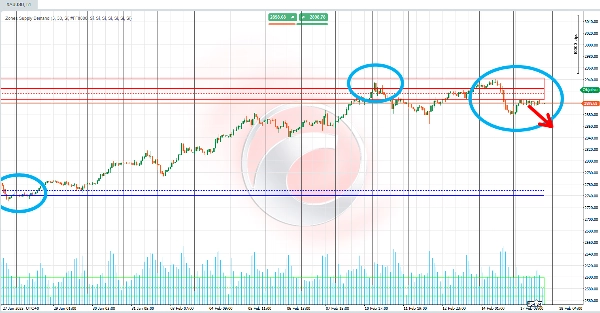
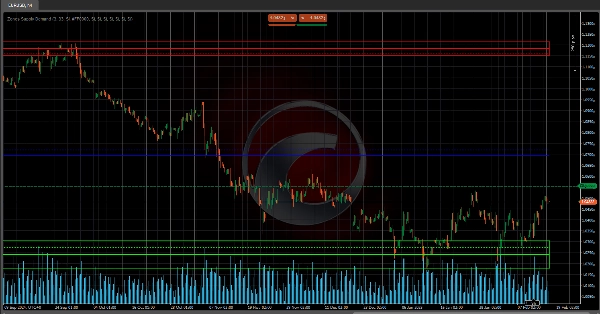
Algoritma, fiyat hareketini hacim birikimi yoluyla analiz eder, görünür fiyat aralığını (yüksekten düşüğe) birden çok segment veya "aralık" olarak böler. 📏 Her aralık için, oluşturulan hacmi hesaplar ve bunu önceden belirlenmiş eşik yüzdesi ile karşılaştırır. Amaç? Hacim yoğunluğunun o kadar yüksek olduğu seviyeleri belirlemek ki bu, bir Arz Bölgesi veya Talep Bölgesi işaret eder! 🎯
📉 Arz Bölgesi için:
- En yüksek fiyattan başlayın ve aralıklar boyunca aşağı doğru ilerleyin.
- Her segmentte hacmi biriktirin.
- Biriken hacim eşik değeri aştığında, bu bir Arz Bölgesi 🚨 olarak işaretlenir.
- Bu seviyeden yükseğe kadar renkli bir alan (belirli opaklıkta dikdörtgen) çizilir ve bu bölgedeki fiyatların basit ve ağırlıklı ortalamalarını gösteren yatay çizgiler eklenir. 🖍️
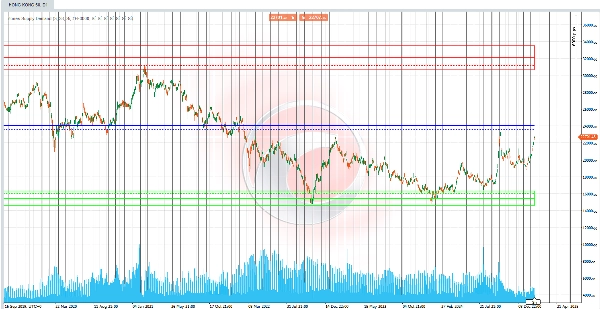
📈 Talep Bölgesi için:
- En düşük fiyattan başlayın ve aralıklar boyunca yukarı doğru ilerleyin.
- Her segmentte hacmi biriktirin.
- Biriken hacim eşik değeri geçtiğinde, bu bir Talep Bölgesi 🚨 olarak tanımlanır.
- Buna karşılık gelen bir alan çizilir ve ortalama çizgilerle ortalama yoğunluk seviyesi vurgulanır. 🖌️
⚖️ Piyasa Dengesi:
Hem Arz hem de Talep Bölgeleri belirlendiğinde, algoritma Piyasa Denge Noktası hesaplar! 🌟 Bu denge, iki bölge arasındaki ortalama (basit veya hacim ağırlıklı) ile türetilir. Sonuç? Alım ve satım baskısı arasındaki dengeyi gösteren grafik üzerinde net referans çizgileri! ⚖️✨
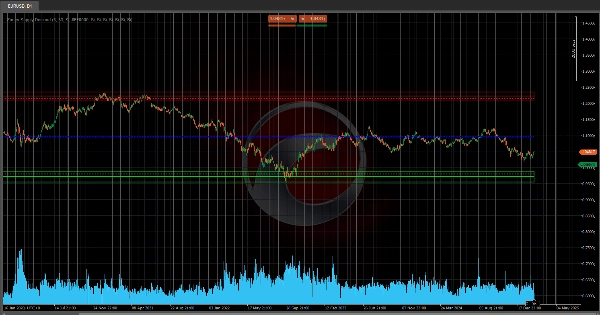
✅ Özetle:
"Bölgeler Arz & Talep" göstergesi, önemli emir yoğunluğu alanlarını tespit etmek için hacim tabanlı fiyat segmentasyonu kullanır. 🗝️ Ardından, grafik üzerinde kritik seviyeleri vurgulamak için görsel ipuçları (renkli bölgeler, ortalama çizgiler ve denge noktaları) oluşturur, böylece yatırımcıların arz-talep dengesizliklerini ve potansiyel dönüş noktalarını fark etmelerini sağlar! 🚀💡
Özet
Müşteri değerlendirmeleri
5 | 0 % | |
4 | 50 % | |
3 | 50 % | |
2 | 0 % | |
1 | 0 % |