
Descripción
Resumen
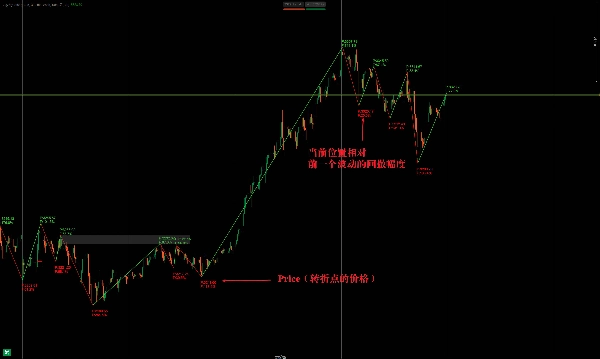
El indicador ZigZag es una herramienta de análisis técnico utilizada principalmente para identificar puntos clave de reversión de precios filtrando el ruido del mercado. Conecta máximos y mínimos significativos con líneas ZigZag, ayudando a los traders a visualizar tendencias y posibles rupturas.
Cómo funciona
- Funcionalidad principal
-
- Elimina las fluctuaciones menores de precio estableciendo un umbral mínimo de cambio de precio (porcentaje o valor fijo).
- Solo conecta máximos/mínimos significativos, simplificando el análisis de tendencias.
- Se usa frecuentemente para detectar niveles de soporte/resistencia, reversiones (por ejemplo, cabeza y hombros, dobles techos/suelos).
- Parámetros clave
-
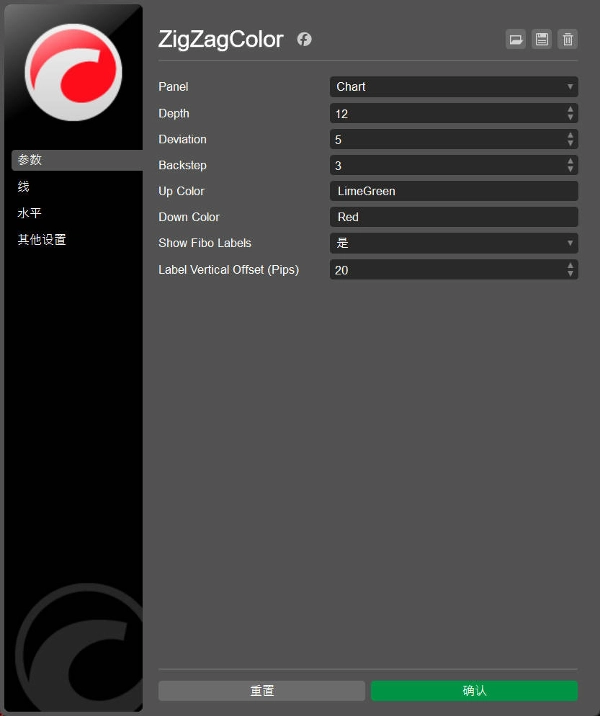
- Movimiento mínimo de precio (%): Determina la sensibilidad (por ejemplo, 5% ignora movimientos menores a este).
- Profundidad de retroceso: Controla cuántas velas pasadas se analizan, afectando el retraso.
Aplicaciones principales
1. Identificación de tendencias
- Tendencias alcistas: Máximos más altos (HH) + mínimos más altos (HL).
- Tendencias bajistas: Máximos más bajos (LH) + mínimos más bajos (LL).
- Ayuda a trazar líneas de tendencia para posibles operaciones de ruptura.
2. Reconocimiento de patrones
- Revela patrones clásicos de gráficos (triángulos, banderas, cuñas) definiendo puntos de oscilación.
3. Niveles de retroceso de Fibonacci
- Marca máximos/mínimos claros para extensiones o retrocesos de Fibonacci.
4. Detección de divergencias
- Destaca divergencias entre el precio y osciladores (RSI, MACD).
El indicador ZigZag es una herramienta de análisis técnico utilizada principalmente para identificar puntos clave de reversión en la tendencia de precios, ayudando a los traders a filtrar el ruido del mercado y resaltar máximos y mínimos importantes. A continuación, se presentan sus puntos clave y usos:
Principio del indicador ZigZag
- Función básica:
-
- Ignora automáticamente pequeñas fluctuaciones estableciendo un umbral de cambio de precio (porcentaje o valor fijo), conectando solo los máximos y mínimos significativos para formar líneas ZigZag.
- Se usa comúnmente para ayudar a identificar niveles de soporte/resistencia y reversiones de tendencia (como cabeza y hombros, doble suelo, etc.).
- Parámetros clave:
-
- Amplitud mínima de movimiento (por ejemplo, 5% o puntos): determina la sensibilidad para filtrar pequeñas fluctuaciones. Cuanto mayor sea el valor, menos señales pero más fiables.
- Profundidad de retroceso: controla la cantidad de velas consideradas en el cálculo, afectando la demora en la detección de puntos de inflexión.
Usos principales
- Identificación de tendencias:
-
- Determina la dirección de la tendencia mediante máximos consecutivos más altos (tendencia alcista) o mínimos consecutivos más bajos (tendencia bajista).
- Combinado con líneas de tendencia, permite anticipar rupturas o retrocesos.
- Análisis de patrones:
-
- Identifica patrones clásicos de precios (como triángulos, banderas), las líneas ZigZag muestran claramente los límites de los patrones.
- Uso con herramientas de Fibonacci:
-
- Los puntos altos/bajos marcados por ZigZag se usan como puntos de inicio/fin para retrocesos o extensiones de Fibonacci.
- Detección de divergencias:
-
- Cuando el precio y los indicadores (como RSI, MACD) divergen, ZigZag ayuda a confirmar los puntos de inicio y fin de la divergencia.


