
Deskripsi
Indikator Breakout Volatilitas - Mesin Volatilitas Hawkes
Indikator ini dimaksudkan untuk memberikan konteks, bukan tindakan perdagangan langsung. Komponen volatilitas membantu Anda mengetahui kapan kondisi pasar berubah - periode volatilitas rendah sering mendahului pergerakan besar, dan periode volatilitas tinggi akhirnya habis. Komponen EWMA menjaga Anda tetap terorientasi dengan tren yang berkembang dan menyoroti saat harga menjauh darinya.
Gabungkan kedua perspektif ini - rezim volatilitas dan konteks tren - dengan metodologi dan penilaian perdagangan Anda sendiri. Indikator menunjukkan lingkungan - Anda yang memutuskan apa yang harus dilakukan di dalamnya.
Versi 2.0
Terbuka untuk pembaruan di masa depan
-----------------------------------------------------------------------------------------------------------------------------------------------------------------------
Ikhtisar
-----------------------------------------------------------------------------------------------------------------------------------------------------------------------
Indikator ini menggabungkan dua komponen berbeda untuk membantu pedagang mengidentifikasi rezim volatilitas dan kondisi tren secara bersamaan.
Komponen pertama menggunakan Proses Hawkes untuk mendeteksi perubahan volatilitas pasar. Berbeda dengan indikator volatilitas tradisional, ini tidak memprediksi arah—ini hanya memberi sinyal saat pasar bertransisi dari kompresi tenang ke volatilitas aktif, atau sebaliknya. Anggap saja sebagai detektor status volatilitas: ini memberi tahu Anda kapan keadaan memanas atau mendingin, tetapi tidak ke arah mana harga akan bergerak.
Komponen kedua menambahkan sistem EWMA ganda (Exponential Weighted Moving Average) yang ditampilkan di atas grafik harga Anda. Ini memberi Anda konteks tren menggunakan persilangan rata-rata bergerak cepat dan lambat, dengan lapisan tambahan pewarnaan lilin untuk menunjukkan saat harga menyimpang dari tren.
-----------------------------------------------------------------------------------------------------------------------------------------------------------------------
Cara kerjanya
-----------------------------------------------------------------------------------------------------------------------------------------------------------------------
Deteksi Volatilitas: Indikator menggunakan estimator Volatilitas High-Low Parkinson—metode yang lebih efisien daripada ATR standar karena menggunakan rentang bar penuh. Volatilitas yang dinormalisasi ini masuk ke dalam perhitungan Proses Hawkes, yang kemudian dibandingkan dengan ambang batas berbasis kuantil dinamis.
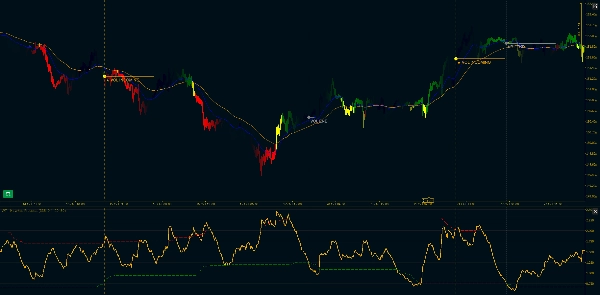
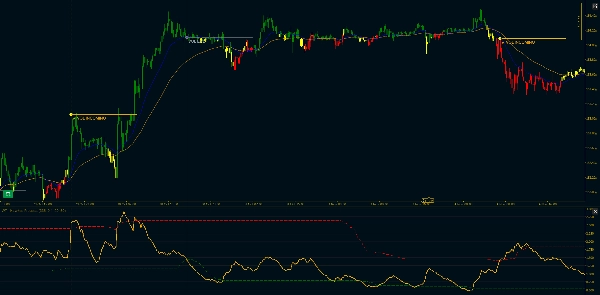
Ketika volatilitas menembus ambang atas setelah periode kompresi, Anda mendapatkan sinyal "VOL INCOMING". Ketika turun kembali di bawah ambang bawah, Anda melihat "VOL END". Ini bukan sinyal masuk—mereka adalah perubahan rezim volatilitas. Pasar sedang bangun atau akan tidur.
Konteks Tren: Dua rata-rata bergerak berbobot eksponensial (Cepat dan Lambat) muncul di grafik utama Anda. MA Cepat berwarna biru, MA Lambat berwarna oranye. Ketika Cepat di atas Lambat, tren naik. Ketika Cepat di bawah Lambat, tren turun.
Filter Divergensi: Di sinilah menjadi menarik. Kadang-kadang harga menjauh secara signifikan dari tren. Ketika seluruh lilin (buka, tinggi, rendah, tutup) berada di bawah MA Cepat selama tren naik, atau di atasnya selama tren turun, batang berubah menjadi kuning. Ini adalah filter ketat—jika bahkan sumbu menyentuh MA Cepat, warnanya tetap warna tren normal.
Batang kuning sering muncul pada retracement atau titik kelelahan, tetapi ingat: mereka tidak memberi tahu apa yang akan terjadi selanjutnya, hanya bahwa harga sementara terpisah dari garis tren.
-----------------------------------------------------------------------------------------------------------------------------------------------------------------------
Fitur Utama
-----------------------------------------------------------------------------------------------------------------------------------------------------------------------
Komponen Volatilitas:
- Normalisasi Volatilitas High-Low Parkinson (lebih efisien daripada metode ATR standar)
- Perhitungan Proses Hawkes dengan peluruhan yang dapat disesuaikan (parameter Kappa)
- Ambang batas berbasis kuantil dinamis (persentil yang dapat disesuaikan)
- Penanda visual: "VOL INCOMING" pada breakout volatilitas, "VOL END" pada kompresi
- Penyaringan kelanjutan: hanya breakout pertama yang ditandai, bukan setiap lonjakan
- Garis tren horizontal opsional dan penanda vertikal
Komponen Tren EWMA:
- Perhitungan EWMA kompatibel dengan Pandas (formula adjust=True)
- Garis MA Cepat dan Lambat ditampilkan di grafik harga utama
- Panjang rentang yang dapat disesuaikan (default: 20/50)
- Dukungan periode minimum (menekan output sampai data cukup)
- Opsi abaikan NA untuk menangani celah
- Sistem lilin tiga warna: Hijau (tren naik), Merah (tren turun), Kuning (divergensi)
Opsi Kustomisasi:
- Periode Parkinson (periode lihat balik untuk perhitungan volatilitas)
- Hawkes Kappa (tingkat peluruhan, memengaruhi sensitivitas)
- Periode Lihat Balik Kuantil
- Ambang Batas Volatilitas Rendah dan Tinggi (persentil)
- Tombol tahunan dan panjang segmen
- Rentang Cepat dan Lambat untuk rata-rata bergerak
- Warna Bullish, Bearish, dan Divergensi
- Panjang ekstensi garis tren
- Tampilkan/sembunyikan penanda vertikal
----------------------------------------------------------------------------------------------------------------------------------------------------------------------------
Catatan Teknis: Komponen Proses Hawkes menggunakan perhitungan eksponensial rekursif yang dioptimalkan untuk penggunaan waktu nyata. Implementasi EWMA sesuai dengan perilaku Pandas untuk konsistensi dengan backtesting berbasis Python. Kedua komponen hanya menghitung pada bar yang sudah tertutup untuk menghindari repainting.
Ringkasan
Ulasan pelanggan
5 | 100 % | |
4 | 0 % | |
3 | 0 % | |
2 | 0 % | |
1 | 0 % |


![Logo "[Stellar Strategies] MARSI Signal Plotter"](https://cdn.ctrader.com/image/webp/7b2b8da6-8f8e-4646-8d4a-4710c516c01e_25567)

