
الوصف
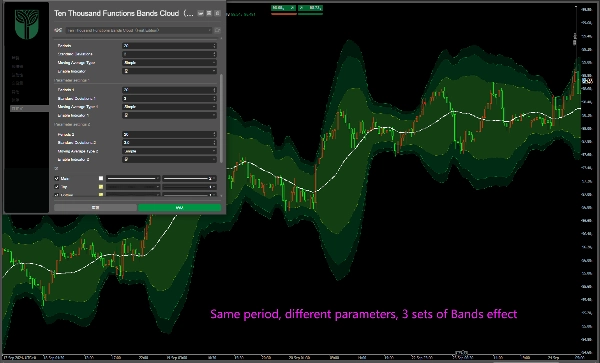
مجموعات 3 عادية من الباندات:
الفترة:20
الانحرافات:2.0؛ 3.0؛ 3.5؛
مدعوم بخلفية سحابية!
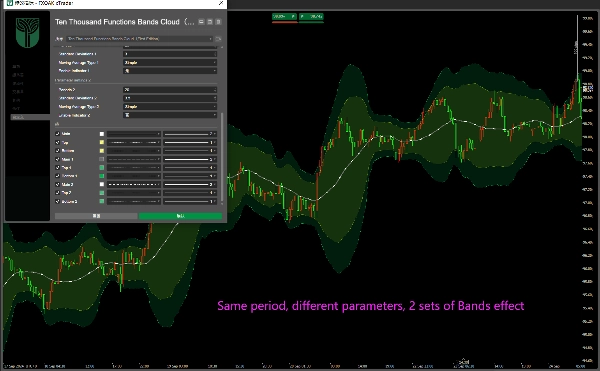
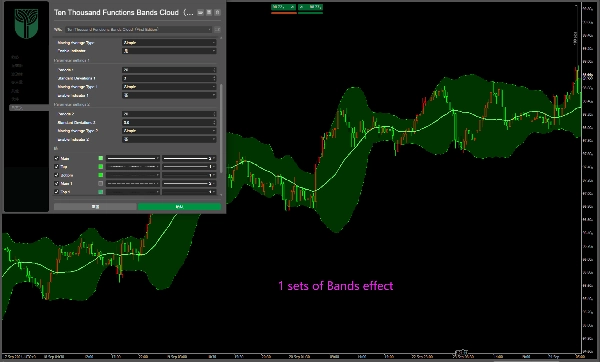
يمكنك إغلاق أو فتح أي مجموعة واحدة أو مجموعتين؛ ويمكن تعديل وإعداد معلمات مختلفة!
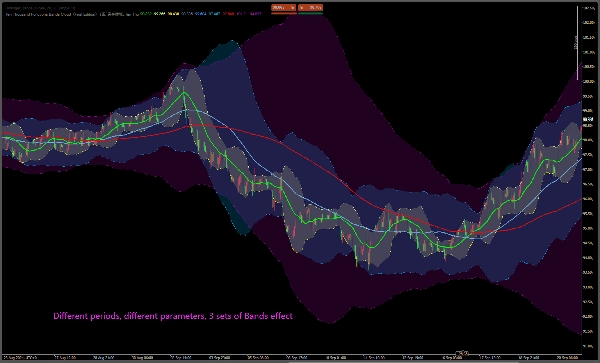
يمكن أيضًا تعديله إلى قيم أخرى، مثل 2.0:20، 60، 144 باندات؛
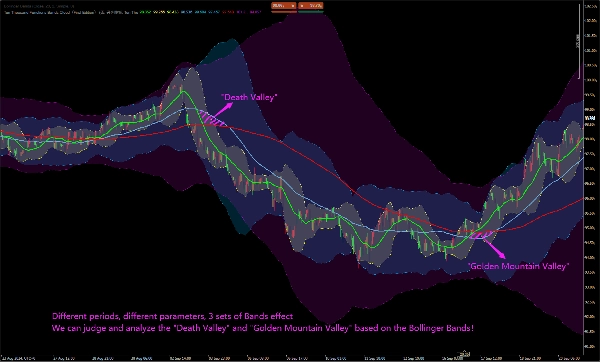
المسار الأوسط للباندات يساوي المتوسط المتحرك، وهو المتوسطات المتحركة لـ 20، 60، و144!
يمكننا الحكم وتحليل "وادي الموت" و"وادي الجبل الذهبي" بناءً على المسار الأوسط لباندات بولينجر!
常规3组Bands:
周期:20
偏差:2.0;3.0; 3.5;
支持云背景!
您可以关闭或打开任意一个或两个组;并且可以修改和设置不同的参数!
它也可以修改为其他值,如2.0:20、60、144布林带;
Bands中轨等于移动平均线,即20、60和144移动平均线!
我们可以根据布林中轨迹来判断和分析“死亡谷”和“金山谷”等......
標準3グループボリンジャーバンド(Bands):期間:20;偏差値:2.0;3.0;3.5;クラウドバックグラウンドに対応!任意の1グループまたは2グループをオン/オフ設定することが可能です。また、各パラメーターの修正と設定も行えます。他の数値に変更することも可能です。例えば2.0の偏差値で、期間20、60、144のボリンジャーバンドに設定するなど。ボリンジャーバンドの中線は移動平均線に等しく、すなわち期間20、60、144の移動平均線です。ボリンジャーバンドの中線に基づいて、「デッドバレー(死亡谷)」や「ゴールドバレー(金山谷)」などを判断・分析することができます。
Стандартные 3 группы Бандов (Полос Боллинджера): Период: 20; Отклонение: 2,0; 3,0; 3,5; Поддержка облачного фона! Вы можете отключить или включить любую одну или две группы; кроме того, вы можете изменять и настраивать различные параметры! Его также можно изменить на другие значения, например, Боллинджеры с отклонением 2,0 и периодами 20, 60, 144; Средняя линия Бандов равна скользящей средней, то есть скользящим средним с периодами 20, 60 и 144! Мы можем определять и анализировать такие явления, как «Мёртвая долина» и «Золотая долина», на основе средней линии 。
الملخص
تقييمات العملاء
5 | 100 % | |
4 | 0 % | |
3 | 0 % | |
2 | 0 % | |
1 | 0 % |


![شعار "[Hamster-Coder] Bollinger Bands"](https://cdn.ctrader.com/image/webp/21d8e5d6-fb11-4bac-b9ee-cd05c2b76804_30327)


