
คำอธิบาย
indicator ที่ระบายสีแท่งเทียนแบบเรียลไทม์ตามโครงสร้างตลาดและวาดโซนสภาพคล่อง การไหลของสถาบัน และช่วงการรวมตัว ออกแบบมาสำหรับเทรดเดอร์ที่ดำเนินการภายใต้ Smart Money Concepts (SMC) หลักการ.
🧠 Algorithm Logic
https://chartshots.spotware.com/c/69f0e3fd81319
1. การตรวจจับโครงสร้างตลาด 🔍
- ค้นหาจุดเปลี่ยน (จุดสูงและต่ำในท้องถิ่น) โดยใช้ช่วงเวลาย้อนกลับที่ตั้งค่าได้.
- เปรียบเทียบจุดเปลี่ยนต่อเนื่อง เพื่อกำหนดโครงสร้าง:
-
- Higher Highs + Higher Lows = แนวโน้มขาขึ้น 📈
- Lower Highs + Lower Lows = แนวโน้มขาลง 📉
- สัญญาณผสม = แนวโน้มเป็นกลาง ➡️
- กรองเสียงรบกวน: นับเฉพาะจุดเปลี่ยนที่เคลื่อนที่เกินเกณฑ์ที่ตั้งไว้โดยอิงจาก ATR (Average True Range) คูณด้วยความไวที่ปรับได้.
https://chartshots.spotware.com/c/69f0e7e752b74
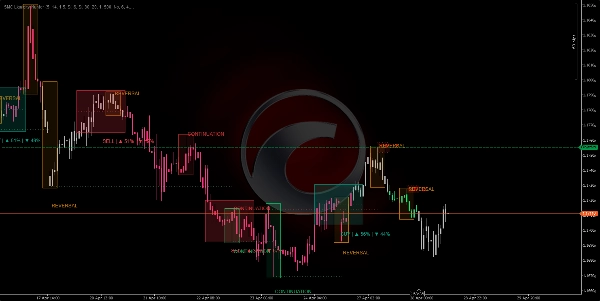
2. การไหลของสถาบัน (Flow Boxes) 🔄
- ทุกครั้งที่เกิดจุดเปลี่ยนสำคัญใหม่ อัลกอริทึม วาดเส้นแนวนอน จากจุดเปลี่ยนก่อนหน้าไปยังจุดใหม่.
- จำแนกการไหล เป็น:
-
- ต่อเนื่อง: ราคาปฏิบัติตามแนวโน้ม (HL ในแนวโน้มขาขึ้น, LH ในแนวโน้มขาลง) ✅
- กลับตัว: ราคาทะลุโครงสร้าง (LL ในแนวโน้มขาขึ้น, HH ในแนวโน้มขาลง) ⚠️
- วาด กล่องสี รอบจุดเปลี่ยนที่ติดป้าย "CONTINUATION" หรือ "REVERSAL".
3. โซนอุปทาน/อุปสงค์ (สภาพคล่อง) 💧
https://chartshots.spotware.com/c/69f0e8e7aef29
- รอบจุดเปลี่ยนสำคัญแต่ละจุด แถบแนวนอน ถูกวาดขยายไปข้างหน้าเป็นจำนวนแท่งที่ตั้งค่าได้.
- โซนเหล่านี้แทน คำสั่งสถาบันที่ยังไม่ถูกดำเนินการ:
-
- จุดเปลี่ยนขาลง → โซนอุปทาน (คำสั่งขาย) 🔴
- จุดเปลี่ยนขาขึ้น → โซนอุปสงค์ (คำสั่งซื้อ) 🟢
- โซน แตกและหายไป เมื่อราคาทะลุด้วยแรงเพียงพอหรือเมื่ออายุการใช้งานหมด.
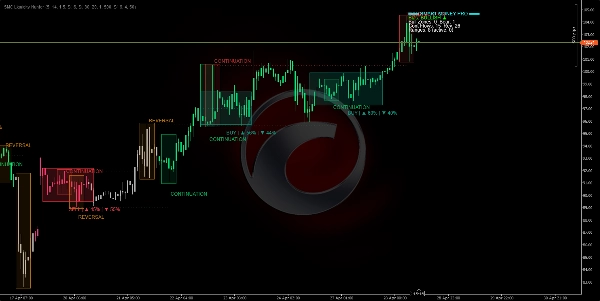
4. เครื่องตรวจจับช่วง (การรวมตัว) 📦
- คำนวณ ค่าเฉลี่ยเคลื่อนที่อย่างง่าย (SMA) พร้อม แถบ ATR รอบๆ มัน.
- ถ้า ทุกแท่งเทียน ภายในหน้าต่างย้อนกลับอยู่ภายในแถบนี้ อัลกอริทึมจะระบุว่าเป็น ช่วงการรวมตัว.
- วาด สี่เหลี่ยมสีน้ำเงิน พร้อม:
-
- เส้นกลางประ (สมดุลช่วง) ⚖️
- เปอร์เซ็นต์ความน่าจะเป็นการเบรกเอาต์ ขาขึ้น/ขาลงตาม:
-
- โมเมนตัมทิศทาง (ADX/DI+ เทียบกับ DI-) 📐
- ปริมาณสะสมขาขึ้นเทียบกับขาลงภายในช่วง 📊
- เวลาที่ใช้ในครึ่งบนเทียบกับครึ่งล่าง ⏱️
5. การระบายสีแท่งเทียน (สะอาด & มองเห็นได้) 🕯️
- แท่งเทียนสีเขียว = โครงสร้างขาขึ้นที่ได้รับการยืนยัน (HH+HL) 🟢
- แท่งเทียนสีม่วงแดง/แดง = โครงสร้างขาลงที่ได้รับการยืนยัน (LH+LL) 🔴
- แท่งเทียนสีเทา = ช่วงเป็นกลางหรือช่วงเปลี่ยนผ่าน ⚪
- ไม่มีสี่เหลี่ยมทับซ้อน: ไส้เทียนและตัวแท่งจริงมองเห็นได้ชัดเจนตลอดเวลา.
📋 แดชบอร์ด (มุม)
สรุปตัวเลขของโซนที่ใช้งาน การไหล และช่วง
🛠️ วิธีใช้งาน
⚙️ การตั้งค่าที่แนะนำ
- กรอบเวลา: H1 หรือสูงกว่า (เหมาะสำหรับ Smart Money).
- พารามิเตอร์เริ่มต้น: ทำงานได้ดีสำหรับ Forex, ดัชนี และคริปโต.
- ปรับความไว: เพิ่มสำหรับตลาดผันผวน ลดสำหรับตลาดที่เคลื่อนไหวไซด์เวย์.
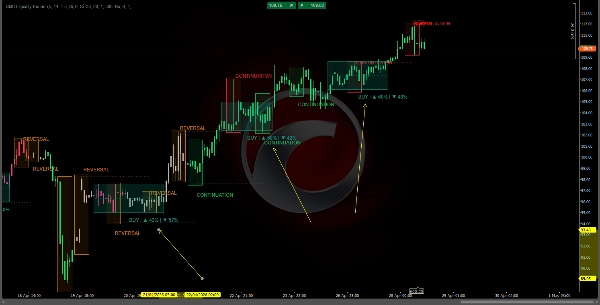
📗 กฎการเทรด :
✅ การเข้าซื้อ (BUY)
- แท่งเทียนต้องเป็น สีเขียว (แนวโน้มขาขึ้นกำลังทำงาน) 🟢
- ราคาสัมผัสหรือเข้าใกล้ โซน "DEMAND" ที่ใช้งานอยู่ 🟢
- มี กล่อง "CONTINUATION" (ไม่ใช่ "REVERSAL") ปรากฏที่โซนนั้น ✅
- แดชบอร์ดแสดง ความน่าจะเป็นเบรกเอาต์ขาขึ้น > 60% บนช่วงที่ใช้งาน (ถ้ามี) 📊
✅ การเข้าขาย (SELL)
- แท่งเทียนต้องเป็น สีม่วงแดง/แดง (แนวโน้มขาลงกำลังทำงาน) 🔴
- ราคาสัมผัสหรือเข้าใกล้ โซน "SUPPLY" ที่ใช้งานอยู่ 🔴
- มี กล่อง "CONTINUATION" (ไม่ใช่ "REVERSAL") ปรากฏที่โซนนั้น ✅
- แดชบอร์ดแสดง ความน่าจะเป็นเบรกเอาต์ขาลง > 60% 📊
❌ หลีกเลี่ยงการเทรดถ้า...
- แท่งเทียนเป็น สีเทา (ไม่มีแนวโน้มชัดเจน) ⚪
- มีสัญญาณ "REVERSAL" ปรากฏตรงที่คุณกำลังจะเข้าเทรด ⚠️
- ราคายังอยู่ ภายในช่วงสีน้ำเงิน โดยยังไม่มีการเบรกเอาต์ชัดเจน 🔵
- แดชบอร์ดแสดง ความขัดแย้งตรงกันข้าม (ความขัดแย้งขาลงในเซ็ตอัพขาขึ้น หรือในทางกลับกัน) 🔄
📈 การตีความแดชบอร์ด
text
═══ SMART MONEY PRO ═══
แนวโน้ม: ขาขึ้น ▲ ← แนวโน้มตลาดปัจจุบัน
โซนกระทิง: 2 หมี: 1 ← โซนสภาพคล่องที่ใช้งาน
การไหลต่อเนื่อง: 3 กลับตัว: 0 ← การต่อเนื่องกับการกลับตัว
ช่วง: 4 (ใช้งาน: 1) ← ช่วงทั้งหมดและช่วงที่ใช้งาน
ช่วงที่ใช้งาน ▲65% ▼35% ← ความน่าจะเป็นเบรกเอาต์
⚡ สัญญาณความสอดคล้องขาขึ้น ← สัญญาณการจัดตำแหน่งสูงสุด
💡 หลักการสำคัญ
- ✅ ไม่มีการรีเพนท์: ทุกอย่างคำนวณโดยใช้ข้อมูลแท่งที่ปิดแล้วเท่านั้น.
- ✅ กราฟสะอาด: แท่งเทียนจริงที่มีสี, โซนโปร่งแสง, ไม่มีความรกทางสายตา.
- ✅ ดูโครงสร้างล่วงหน้า: สีแท่งเทียนบอกช่วงตลาดก่อนที่จุดเปลี่ยนจะชัดเจน.
- ✅ ความสอดคล้องในตัว: เมื่อโซนที่ใช้งาน + ช่วงที่ใช้งาน + สัญญาณการไหลทั้งหมดตรงกัน แดชบอร์ดจะแจ้งเตือนอย่างชัดเจน.
สรุป
Key features include:
- **Institutional Flows:** Draws horizontal lines and colored boxes between significant pivots, labeling flows as "CONTINUATION" or "REVERSAL" to indicate trend respect or break.
- **Supply and Demand Zones:** Highlights unexecuted institutional orders with horizontal bands around pivots, distinguishing supply (sell) and demand (buy) zones that expire or break upon price penetration.
- **Range Detection:** Identifies consolidation ranges using an SMA with ATR bands, marking them with blue rectangles and providing breakout probability percentages based on momentum, volume, and time distribution.
- **Dashboard:** Displays numeric summaries of active zones, flows, ranges, and breakout probabilities, including confluence signals when multiple factors align.
Recommended for use on H1 or higher timeframes, the indicator suits Forex, indices, and cryptocurrencies. It operates without repainting by relying on closed bar data and maintains a clean chart presentation with visible candle wicks and bodies.
รีวิวจากลูกค้า
5 | 50 % | |
4 | 0 % | |
3 | 0 % | |
2 | 50 % | |
1 | 0 % |


