คำอธิบาย
ตัวชี้วัด Pinescriptlabs Store: Pinescriptlabs Store cBots : (cBot) Gold & BTC BreakoutSession Pivots(ใหม่)
PRICE ACTION (ใหม่)
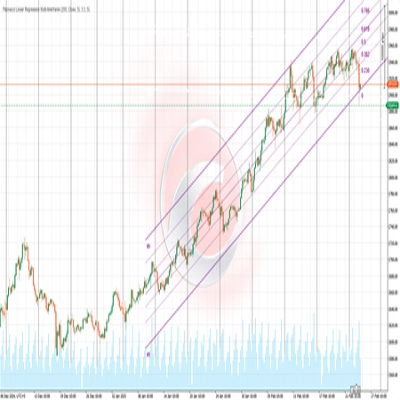
Prediction Based on Linreg & ATR
SmartTrend Support &
Resistance
Lines
Dynamic
Market Structure
Analysis
of
Turning
Points
Fibonacci
Linear
Regression
Multi-timeframe
Multi-Level
Candle Bias
Tracker
Auto
Support and
Resistance
Trend
Lines
All
Support and
Resistance
Levels
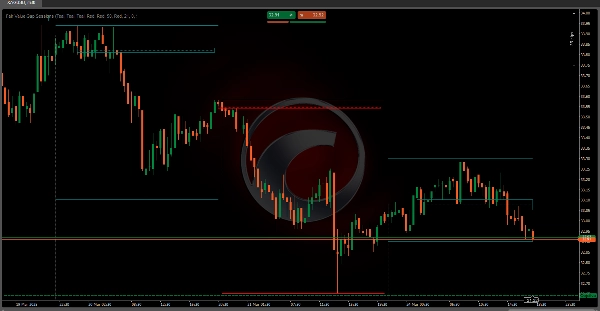
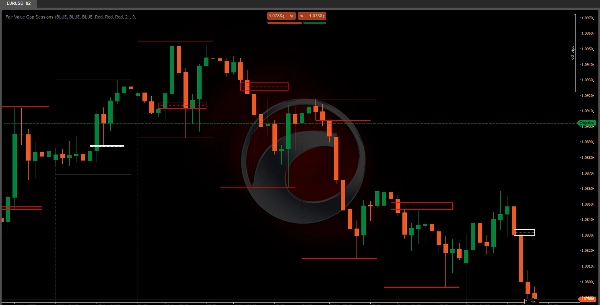
Fair Value Gap Sessions 📊💰
ตัวชี้วัด Fair Value Gap (FVG) เป็นเครื่องมือการซื้อขายที่ซับซ้อนออกแบบมาเพื่อระบุและเน้นความไม่สมบูรณ์ชั่วคราวของตลาดที่เรียกว่า "ช่องว่างมูลค่ายุติธรรม" 🚨 ภายในช่วงเวลาการซื้อขายเฉพาะ ช่องว่างเหล่านี้แสดงถึงช่วงเวลาที่ราคาตลาดเคลื่อนที่อย่างรวดเร็ว ⚡ สร้างความไม่สมดุลระหว่างผู้ซื้อและผู้ขาย
กลไกทางเทคนิคหลัก 🔧
สถาปัตยกรรมตามช่วงเวลา 🕒
• ใช้วิธีวิเคราะห์ตามช่วงเวลาที่แม่นยำและปรับแต่งได้
• อนุญาตให้เทรดเดอร์กำหนดเวลาการเริ่มต้นช่วงเวลาที่กำหนดเองพร้อมรองรับโซนเวลาท้องถิ่นหรือ UTC 🌍
• สร้างขอบเขตช่วงเวลาที่เปลี่ยนแปลงได้ซึ่งรีเซ็ตและติดตามพฤติกรรมตลาด 🔄
ตรรกะการตรวจจับช่องว่างมูลค่ายุติธรรม 🔎
• ใช้วิเคราะห์การเคลื่อนไหวของราคาอย่างลึกซึ้งผ่านแท่งราคาต่อเนื่องหลายแท่ง
• ระบุช่องว่างโดยการเปรียบเทียบ:
o ราคาสูงสุดและต่ำสุดของแท่งต่อเนื่อง 📈📉
o ราคาปิดของแท่งก่อนหน้า ✅
o โครงสร้างราคาของแท่งปัจจุบัน 🔄
การจำแนกประเภทช่องว่าง 🏷️
ตัวชี้วัดจะแยกความแตกต่างระหว่างช่องว่างหลักสองประเภท:
- ช่องว่างมูลค่ายุติธรรมแบบขาขึ้น 📈
o เกิดขึ้นเมื่อราคากระโดดสูงกว่าจุดสูงสุดก่อนหน้า 🔺
o บ่งชี้ถึงแรงขับเคลื่อนตลาดขาขึ้น 🚀
o สัญญาณแรงกดดันซื้อ 💸 - ช่องว่างมูลค่ายุติธรรมแบบขาลง 📉
o เกิดขึ้นเมื่อราคาตกต่ำกว่าจุดต่ำสุดก่อนหน้า 🔻
o บ่งชี้ถึงแรงขับเคลื่อนตลาดขาลง ⬇️
o สัญญาณแรงกดดันขาย 🛑
การประยุกต์ใช้ในการซื้อขาย 📱💼
ข้อมูลเชิงกลยุทธ์ 💡
• ช่วยให้เทรดเดอร์เห็นภาพความไม่สมบูรณ์ของตลาด 🖼️
• ให้สัญญาณเตือนล่วงหน้าของการกลับตัวของแนวโน้ม ⚠️
• ให้การระบุจุดเข้าและออกที่แม่นยำ 🎯
คุณสมบัติการจัดการความเสี่ยง 🛡️
• การแสดงผลด้วยสีที่แตกต่างกันตามสถานะช่องว่าง 🎨
• ติดตามการ "บรรเทา" ช่องว่าง (เมื่อราคากลับเข้าสู่โซนช่องว่าง) ↔️
• อนุญาตการตั้งค่าสีที่ปรับแต่งได้สำหรับสภาวะตลาดต่าง ๆ 🎨
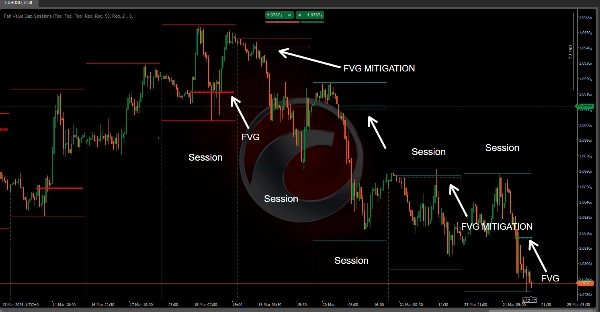
การแสดงผลทางเทคนิค 🎨
ตัวชี้วัดสร้างองค์ประกอบภาพหลักสองอย่าง:
- สี่เหลี่ยมพื้นที่ช่องว่าง 🟩
o แสดงช่วงราคาของช่องว่างที่ระบุ 📐
o ขยายแบบไดนามิกตลอดช่วงเวลาการซื้อขาย ➡️
o เปลี่ยนสีตามสถานะช่องว่าง (ใช้งาน/บรรเทา) 🟩➡️🟨 - เส้นระดับ 📏
o วางตำแหน่งที่จุดกึ่งกลางของช่องว่าง ⚫
o ช่วยให้เทรดเดอร์ระบุโซนราคากลางของช่องว่างได้อย่างรวดเร็ว 📍
o ใช้สไตล์เส้นที่แตกต่างกันเพื่อแสดงสถานะช่องว่าง ➔
กลยุทธ์การซื้อขายที่ใช้งานได้จริง 📝
กลยุทธ์สัญญาณเข้า 🚦
• ใช้การตรวจจับช่องว่างเป็นสัญญาณการต่อเนื่องของแนวโน้ม 🔄
• มองหาราคาที่กลับมายังช่องว่าง (บรรเทา) เป็นการยืนยัน ✅
• รวมกับตัวชี้วัดทางเทคนิคอื่น ๆ เพื่อการตัดสินใจที่มั่นคง 🤝
เทคนิคการจัดการความเสี่ยง 🛡️
• ตั้งจุดหยุดขาดทุนใกล้ขอบเขตช่องว่าง ⛔
• ใช้จุดกึ่งกลางช่องว่างเป็นระดับสนับสนุน/ต้านทานที่เป็นไปได้ 🪜
• ติดตามการบรรเทาช่องว่างเป็นสัญญาณการกลับตัวของแนวโน้ม ↔️⚠️
ความยืดหยุ่นในการตั้งค่า ⚙️
• กำหนดเวลาการเริ่มต้นช่วงเวลาได้เอง ⏰
• การตั้งค่าโซนเวลา (UTC/ท้องถิ่น) 🌍
ด้วยการเข้าใจและใช้งานตัวชี้วัด Fair Value Gap Sessions อย่างถูกต้อง เทรดเดอร์จะได้รับข้อมูลเชิงลึกที่ลึกซึ้งยิ่งขึ้นเกี่ยวกับพลวัตของตลาด ระบุโอกาสการซื้อขายที่เป็นไปได้ และตัดสินใจได้อย่างมีข้อมูลมากขึ้นโดยอิงจากความไม่สมบูรณ์ของการเคลื่อนไหวของราคา 🧠📈
สรุป
It classifies gaps into two types: bullish gaps, indicating potential upward momentum and buying pressure, and bearish gaps, signaling possible downward momentum and selling pressure. Visually, it represents gaps with dynamic rectangles showing the price range and a midpoint level line to help traders quickly locate the gap's central price zone. Colors and line styles change to reflect the gap's active or mitigated status.
Traders can use this tool to visualize market inefficiencies, receive early warnings of trend reversals, and identify precise entry and exit points. Risk management features include color-coded gap states, tracking of gap mitigation when price returns to the gap zone, and customizable color settings. The indicator supports practical strategies such as using gap detection for trend continuation signals and combining it with other indicators for decision-making. Stop-loss placement near gap boundaries and monitoring gap mitigation for trend reversal are also supported.
รีวิวจากลูกค้า
5 | 100 % | |
4 | 0 % | |
3 | 0 % | |
2 | 0 % | |
1 | 0 % |