Penerangan
Penunjuk Kedai Pinescriptlabs: Pinescriptlabs Kedai cBots : (cBot) Gold & BTC BreakoutSession Pivots(baru)
Struktur Pasaran Lanjutan: Bos, Choch, SwinLevels, Blok Pesanan, Pencari Struktur Pasaran & Kecairan (Baru)
Algoritma Pintar Jejak (baru)
Ramalan Berdasarkan Linreg & ATR
Sokongan & Trend Pintar
Rintangan
Garis
Dinamik
Analisis Struktur Pasaran
dari
Titik
Pusingan
Fibonacci
Regresi Linear
Berbilang jangka masa
Berbilang Tahap
Bias Lilin
Penjejak
Auto
Sokongan dan
Rintangan
Trend
Garis
Semua
Sokongan dan
Rintangan
Tahap
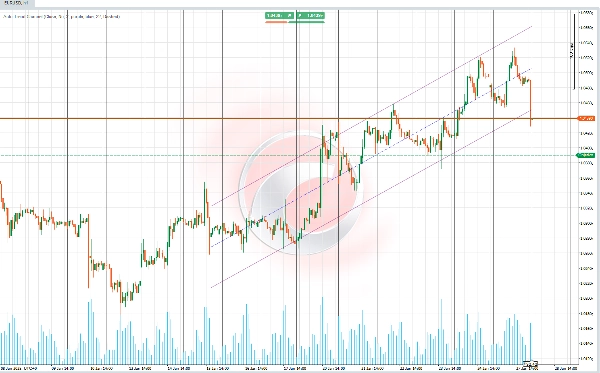
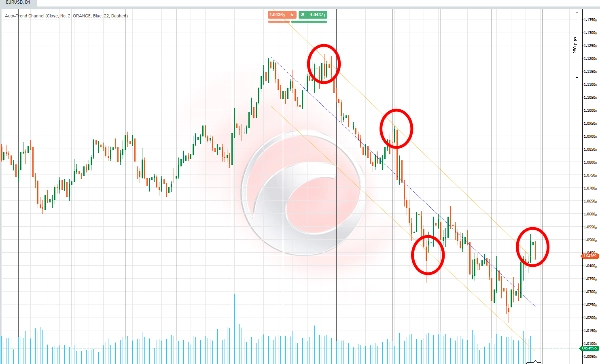
📊 Auto-Saluran Trend 📊
Penunjuk ini melakar saluran trend berdasarkan pengiraan regresi linear dan sisihan piawai data harga (logaritma) untuk tempoh yang dipilih secara automatik. 📈 Tempoh ditentukan menggunakan koefisien korelasi Pearson (RRR), memilih yang mempunyai nilai mutlak tertinggi. 🧮
✨ Fungsi Utama ✨
Fungsi utama adalah untuk mengira saluran trend yang secara automatik menyesuaikan diri dengan panjang tempoh yang paling mewakili, menggunakan statistik lanjutan untuk menentukan sokongan, rintangan, dan garis trend tengah.
Saluran ini merangkumi:
1️⃣ Sebuah garis dasar yang mewakili trend linear yang dikira.
2️⃣ Garis atas dan bawah yang menentukan jalur saluran pada jarak yang berkadar dengan sisihan piawai.
🚀 Ciri-ciri dan Pengiraan 🚀
🔎 Pengiraan Tempoh Optimum
- Penunjuk menilai pelbagai tempoh data (pendek atau panjang, bergantung pada konfigurasi) untuk mencari yang mempunyai korelasi paling tepat dengan tingkah laku pasaran.
- Korelasi Pearson digunakan sebagai metrik utama untuk mengenal pasti tempoh dengan hubungan terkuat antara harga sejarah dan garis trend yang dijana.
📐 Regresi Linear dan Unjuran Harga
- Untuk setiap tempoh yang dinilai, garis regresi dikira berdasarkan logaritma semula jadi harga untuk menstabilkan variasi ekstrem.
- Komponen utama pengiraan termasuk:
-
- Kecerunan: Mewakili kadar perubahan harga.
- Pintas: Titik permulaan garis unjuran.
- Purata: Menetapkan garis dasar rujukan.
📊 Sisihan Piawai dan Had Saluran
- Sisihan piawai harga berbanding garis regresi dikira.
- Jalur atas (rintangan) dan bawah (sokongan) diperoleh dengan melaraskan garis tengah menggunakan pengganda sisihan piawai yang boleh dikonfigurasi oleh pengguna.
🌈 Visualisasi Saluran Trend
- Saluran terdiri daripada tiga elemen utama:
-
- Garis Tengah: Menunjukkan trend utama berdasarkan garis regresi.
- Garis Atas: Mewakili had atas saluran (rintangan), disesuaikan oleh sisihan piawai.
- Garis Bawah: Mewakili had bawah saluran (sokongan), disesuaikan oleh sisihan piawai.
- Pengguna boleh menyesuaikan warna, ketelusan, dan gaya garis saluran untuk kejelasan visual yang lebih baik.
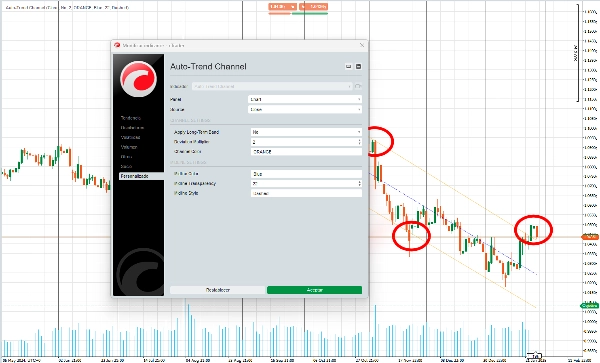
🎛️ Kebolehsuaian dan Konfigurasi
- Pengguna boleh memperibadikan pelbagai aspek penunjuk, seperti:
-
- Warna garis dan saluran.
- Sama ada untuk memberi tumpuan kepada tempoh panjang (trend makro) atau tempoh pendek (trend mikro).
- Kebolehsuaian ini memastikan penunjuk sesuai dengan gaya dagangan dan keutamaan visual yang berbeza.
🔍 Penggunaan :
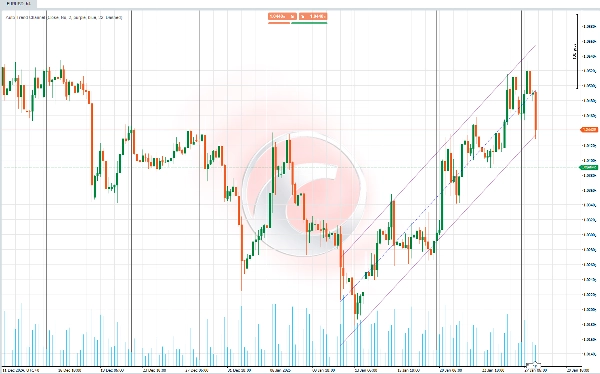
1️⃣ Pengenalpastian Trend
- Garis tengah saluran membantu menentukan sama ada pasaran berada dalam trend menaik, trend menurun, atau trend mendatar.
2️⃣ Sokongan dan Rintangan Dinamik
- Garis saluran atas dan bawah bertindak sebagai zon potensi di mana harga mungkin berubah arah atau mengukuh.
3️⃣ Pengesanan Pengukuhan dan Pecahan
- Harga yang kekal dalam saluran menunjukkan pengukuhan, manakala pecahan menunjukkan perubahan trend atau pergerakan harga yang kuat.
4️⃣ Penyesuaian kepada Gaya Dagangan Berbeza
- Tempoh panjang berguna untuk mengenal pasti trend umum dan membuat keputusan strategik dalam jangka masa yang lebih luas.
- Tempoh pendek membolehkan pedagang menangkap pergerakan lebih pantas dan bertindak balas terhadap perubahan pasaran segera.
Ringkasan
Key features include:
- Optimal period selection by evaluating multiple data intervals to find the strongest correlation between historical prices and the trend line.
- Calculation of slope, intercept, and mean for precise linear regression and price projection.
- Visualization of the trend channel with customizable colors, transparency, and line styles.
- Adaptability for different trading styles by allowing focus on long-term (macro) or short-term (micro) trends.
Use cases:
- Identifying market trends (uptrend, downtrend, sideways) via the central trend line.
- Detecting dynamic support and resistance zones where price may reverse or consolidate.
- Recognizing consolidation phases within the channel and breakouts signaling trend changes or strong price movements.
- Adjusting analysis to suit strategic decisions or faster market responses depending on selected period length.
This indicator supports various markets including cryptocurrencies (BTCUSD), commodities (XAUUSD), and others, providing a statistical approach to trend and channel analysis.
Ulasan pelanggan
5 | 60 % | |
4 | 20 % | |
3 | 20 % | |
2 | 0 % | |
1 | 0 % |