Açıklama
📈 Stokastik RSI
Stokastik RSI göstergesi, fiyat yerine RSI değerlerine Stokastik formülünü uygulayan bir momentum osilatörüdür ve bu nedenle ikinci türev göstergesidir. Standart RSI'den daha yüksek hassasiyetle aşırı alım ve aşırı satım koşullarını belirlemede özellikle faydalıdır.
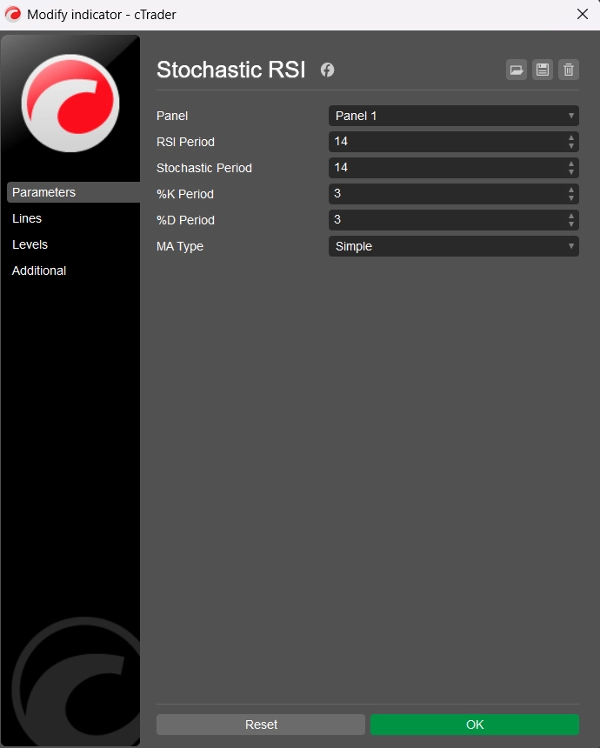
🛠️ Parametreler
RSI Periyodu: Temel RSI'yı hesaplamak için kullanılan geriye dönük dönem (varsayılan = 14)
Stokastik Periyodu: Stokastik RSI'yı hesaplamak için RSI değerlerine uygulanan geriye dönük dönem (varsayılan = 14)
%K Periyodu: %K çizgisi için yumuşatma dönemi (varsayılan = 3)
%D Periyodu: %D çizgisi için yumuşatma dönemi (varsayılan = 3)
MA Türü: Yumuşatma için hareketli ortalama türü: Basit veya Üssel (varsayılan = Basit)
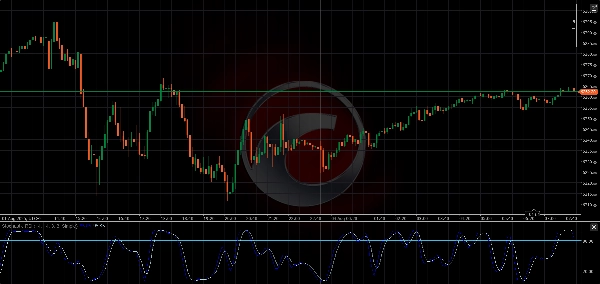
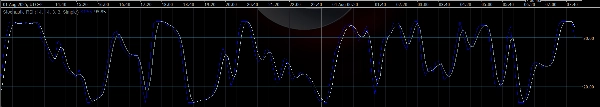
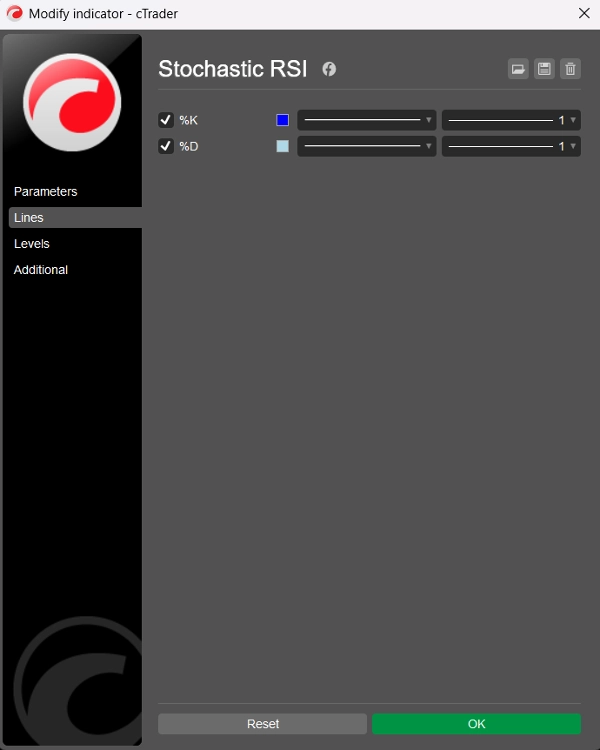
📊 Çıktı Çizgileri
- %K Çizgisi: Yumuşatılmış Stokastik RSI (mavi)
- %D Çizgisi: %K'nın yumuşatılmış hareketli ortalaması (açık mavi)
Her iki çizgi de 0 ile 100 arasında salınım yapar ve aşırı alım ve aşırı satım okumalarını net şekilde sağlar.
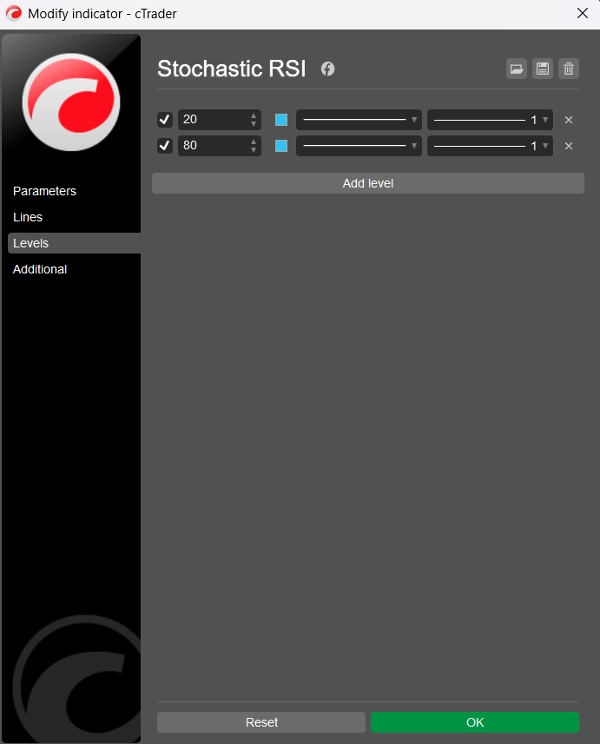
⚠️ Önerilen Seviyeler
Gösterge varsayılan olarak statik seviyeler göstermese de, kullanıcıların bunları “Seviyeler” sekmesi aracılığıyla manuel olarak cTrader'da eklemeleri önerilir:
- Seviye 80 → Aşırı Alım
- Seviye 20 → Aşırı Satım
Bu seviyeler, geleneksel Stokastik Osilatör ile benzer şekilde çalışır ancak RSI davranışına uygulanır, sinyalleri daha keskin ve genellikle daha hızlı yapar.
🧠 Nasıl Kullanılır
- Aşırı Alım (>80): Fiyatın yukarı yönde aşırı genişlemiş olabileceğini gösterir — dönüş veya konsolidasyon potansiyeli.
- Aşırı Satım (<20): Fiyatın aşırı satılmış olabileceğini işaret eder — olası sıçrama veya trend dönüşü.
- %K ve %D Kesişimleri: Stokastik veya MACD'ye benzer şekilde kullanılabilir — 20'nin altında yükseliş kesişimi veya 80'in üzerinde düşüş kesişimi işlem için uygun olabilir.
🏷️ Notlar
- C# ve Automate API kullanılarak cTrader için oluşturulmuştur
- Temiz, verimli ve iki MA türü ile özelleştirilebilir
- Kod ve mantık BlueRocketBots & ChatGPT (OpenAI) tarafından
- Temiz kod (toplam 109 satır; 60 satır kod, 29 satır metin, 20 satır boş)
- Ücretsiz!