
Scalper Signal MTF
Gösterge
256 i̇ndirmeler
Sürüm 1.0, Aug 2025
Windows, Mac
Açıklama
Genel Bakış
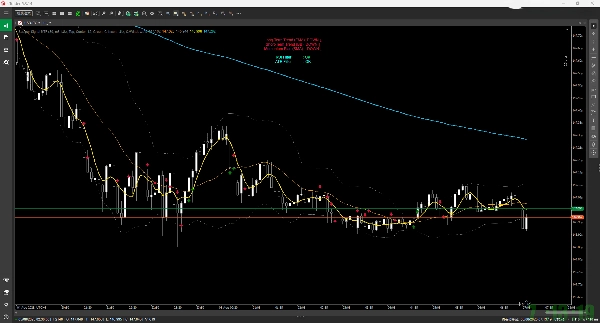
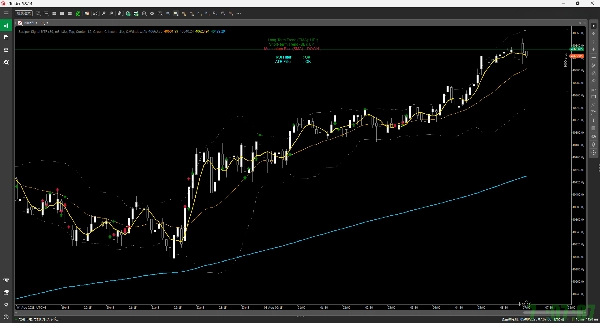
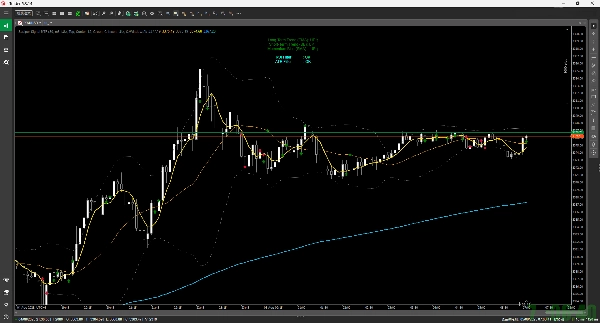
Belirli bir zaman diliminden (örneğin, 5 dakikalık) teknik göstergelere dayanarak, mevcut grafikte al/sat sinyallerini (oklar) gösterir. Ayrıca bir sinyal belirdikten sonra işlemleri simüle eder ve potansiyel çıkış noktasında bir işaret (yıldız) çizer.
Ana Özellikler
- Al/Sat Sinyali Gösterimi:
-
- Al Sinyali (Yukarı Ok): SMA (Basit Hareketli Ortalama) altın kesişimine dayanır, RSI, 200 EMA ve Bollinger Bantları koşullarıyla birleşerek uygun alım fırsatlarını belirler.
- Sat Sinyali (Aşağı Ok): SMA ölüm kesişimine dayanır, RSI, 200 EMA ve Bollinger Bantları koşullarıyla birleşerek uygun satış fırsatlarını belirler.
- İşlem Simülasyonu:
-
- Bir sinyalden sonra, aşağıdaki koşullardan herhangi biri karşılanırsa işlemin kapandığı varsayılır ve grafik üzerinde bir yıldız simgesi ile işaretlenir:
-
- Kar Al / Zarar Durdur (ATR ve belirlenen Risk:Ödül oranına göre).
- Bollinger Bantlarına dokunma (üst/alt bantlar veya orta çizgi).
- Maksimum tutma süresinin aşılması.
- Başabaş ve takip eden durdurmalar da dahili olarak hesaplanır.
- Gösterge Paneli Görüntüleme:
-
- Grafiğin sol üst köşesinde mevcut piyasa ortamının basit bir özetini gösterir; uzun vadeli trend (EMA), kısa vadeli trend (BB) ve momentum (SMA) dahil.
- Uyarı Fonksiyonu:
-
- Yeni bir sinyal oluştuğunda sesli bildirim sağlar.
Parametreler
Göstergenin ayarlarında aşağıdaki öğeleri özgürce özelleştirebilirsiniz:
- Hesaplamalar için kullanılan zaman dilimi (MTF).
- Çeşitli göstergelerin periyotları (SMA, RSI, BB, EMA).
- İşlem çıkış kuralları (örneğin, Risk:Ödül oranı, maksimum tutma süresi).
- Sinyaller ve gösterge paneli için görüntüleme ayarları (görünürlük, renkler, boyut).
Özet
YZ özeti
Scalper Signal MTF is a custom indicator designed for the cTrader platform that provides multi-timeframe scalping signals. It analyzes technical indicators from a chosen timeframe—such as 5 minutes—and displays buy (up arrow) and sell (down arrow) signals on the current chart. Buy signals are generated based on an SMA golden cross combined with RSI, 200 EMA, and Bollinger Bands conditions; sell signals use an SMA dead cross with similar criteria.
The indicator simulates trades after signals appear and marks potential exit points with a star icon. Trade exits are triggered by take profit or stop loss levels (calculated using ATR and a specified risk-reward ratio), touching Bollinger Bands, exceeding maximum holding time, or internal breakeven and trailing stop calculations.
A dashboard on the chart’s top-left summarizes the current market environment, showing long-term trend (EMA), short-term trend (Bollinger Bands), and momentum (SMA). The indicator also provides sound alerts when new signals occur.
Users can customize the timeframe for calculations, indicator periods (SMA, RSI, BB, EMA), trade exit rules, and display settings including signal and dashboard visibility, colors, and sizes.
Gösterge profili
Müşteri değerlendirmeleri
0.0
Değerlendirmeler: 0
Müşteri değerlendirmeleri
Bu ürün için henüz bir değerlendirme yok. Ürünü denediniz mi? O zaman ona dair görüşlerini paylaşan ilk kişi olun!
Tartışma
SSS
cTrader Store üzerinden erişilebilen işlem botları, göstergeler ve eklentiler gibi ürünler, üçüncü taraf sağlayıcılar tarafından sağlanır ve yalnızca bilgilendirme ve teknik erişim amaçlarıyla sunulur. cTrader Store bir broker değildir ve yatırım tavsiyesi, kişisel öneriler vermez veya gelecekteki performansı garanti etmez.
Bu oluşturanın diğer ürünleri


!["[Stellar Strategies] Smart ADX" logosu](https://cdn.ctrader.com/image/webp/af13b084-b6f6-41db-b7bc-c7e688b57b05_36929)

!["[Hamster-Coder] Moving Average MTF" logosu](https://cdn.ctrader.com/image/webp/b11b98b1-194d-4b8e-b00e-d611826ad159_31226)
!["[Hamster-Coder] Bollinger Bands" logosu](https://cdn.ctrader.com/image/webp/21d8e5d6-fb11-4bac-b9ee-cd05c2b76804_30327)


Fiyat
1
Satışlar
1.37K
Ücretsiz yüklemeler