
설명
피벗 포인트 지표
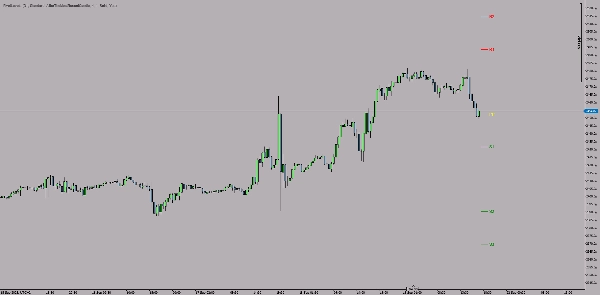
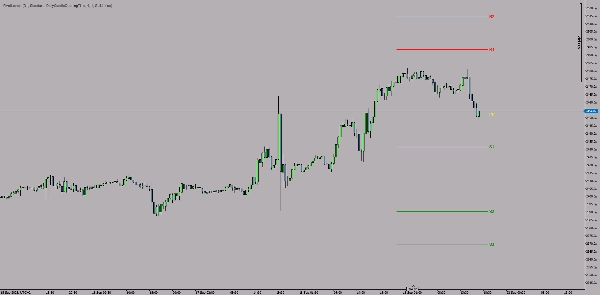
피벗 포인트는 cTrader 플랫폼용 기술 지표로, 차트에 피벗 포인트를 추세선으로 자동 계산하여 표시합니다.
주요 기능:
🎯 피벗 유형:
- 표준 피벗 포인트
- 피보나치 피벗 포인트
- 우디 피벗 포인트
- 카마릴라 피벗 포인트
📊 레벨:
- 중앙 피벗 포인트 (PP) - 노란색
- 저항 레벨 (R1, R2, R3) - 빨간색
- 지지 레벨 (S1, S2, S3) - 초록색
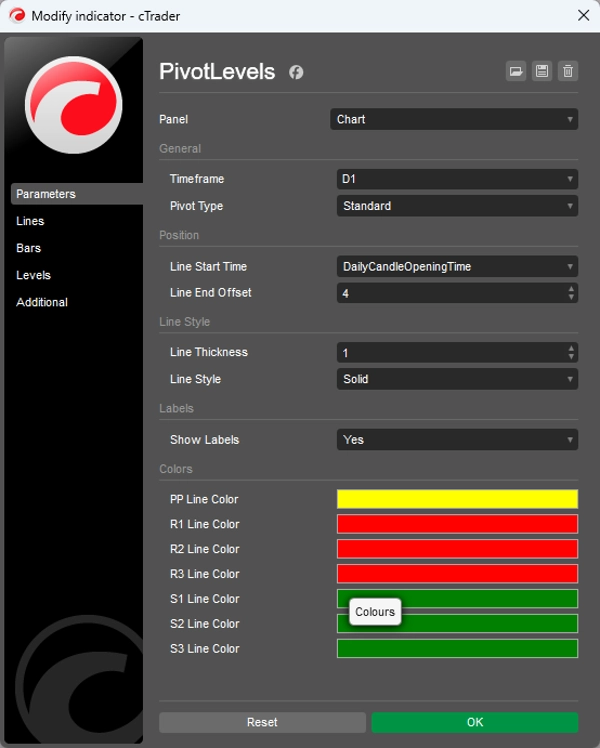
⚙️ 사용자 설정 가능:
- 시간 프레임: 일간, 주간 또는 기타 시간 프레임 선택
- 선 스타일: 두께 (1-5) 및 유형 (실선, 점선 등)
- 위치 지정: 선 시작 시간 및 길이
- 색상: 각 레벨별 색상 개별 조정 가능
- 레이블: 텍스트 레이블 켜기/끄기
💡 사용법:
이 지표는 이전 기간(일/주)의 고가, 저가, 종가(및 시가) 값을 기반으로 피벗 레벨을 계산하여 다음 거래 기간의 주요 지지 및 저항 영역을 식별합니다.
기술적 레벨에 기반한 전략을 사용하는 스윙 및 데이 트레이더에게 이상적입니다.
요약
AI 요약
PivotLevels is a technical indicator for the cTrader platform that automatically calculates and displays pivot points as trendlines on trading charts. It supports multiple pivot point calculation methods, including Standard, Fibonacci, Woodie, and Camarilla pivots. The indicator plots key levels such as the Central Pivot Point (PP) in yellow, resistance levels (R1, R2, R3) in red, and support levels (S1, S2, S3) in green.
Users can customize various settings, including the timeframe for pivot calculation (daily, weekly, or others), line style (thickness and type), line positioning (start time and length), colors for each level, and the option to toggle text labels on or off. The pivot levels are derived from the previous period’s high, low, close, and open prices, helping identify potential support and resistance zones for the upcoming trading period.
This indicator is suitable for traders who use technical levels in their strategies, particularly swing and day traders. It supports multiple markets such as forex, indices, commodities, cryptocurrencies, and stocks.
지표 프로필
고객 리뷰
4.5
리뷰: 2
5 | 50 % | |
4 | 50 % | |
3 | 0 % | |
2 | 0 % | |
1 | 0 % |
고객 리뷰
September 30, 2025
The review gets easier when the decision feels less rushed, and The setup needs patience.
상담
자주 묻는 질문(FAQ)
Prop
Forex
Indices
Commodities
Crypto
Stocks
트레이딩 봇, 지표, 플러그인 등 cTrader Store에서 제공되는 상품은 제3자 개발자에 의해 제공되며, 이는 단순히 정보 및 기술적 접근을 목적으로 제공된 것입니다. cTrader Store는 중개인이 아니며, 투자 조언, 개인별 추천 또는 향후 성과에 대한 어떠한 보장도 제공하지 않습니다.


좋아하실 만한 다른 항목


!["[Stellar Strategies] Inside Bar with Signals" 로고](https://cdn.ctrader.com/image/webp/1d9e8bfa-3b2c-4440-bb37-5856902008a7_30683)


가격
가입일 05/01/2025
14
판매