
Descrição
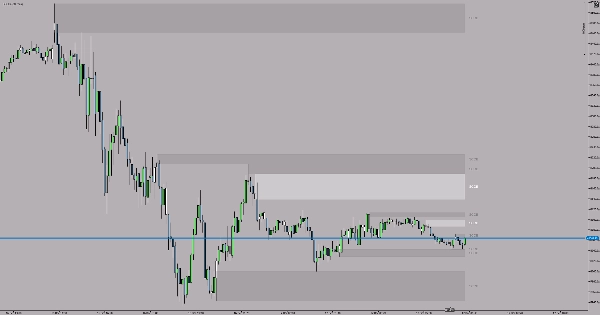
O indicador SCOB (Single Candle Order Block) identifica e destaca automaticamente padrões poderosos de blocos de ordens no seu gráfico. Esta ferramenta simples, mas eficaz, ajuda os traders a identificar padrões-chave de reversão que frequentemente indicam forte atividade institucional.
O que é um SCOB?
Um SCOB é um padrão de três velas que revela zonas potenciais de reversão:
SCOB de alta:
- A 2ª vela faz uma mínima mais baixa que a 3ª vela
- A mínima da 1ª vela permanece acima da mínima da 2ª vela
- A 1ª vela fecha acima da máxima da 2ª vela
- A 2ª vela é destacada como uma zona potencial de suporte
SCOB de baixa:
- A 2ª vela faz uma máxima mais alta que a 3ª vela
- A máxima da 1ª vela permanece abaixo da máxima da 2ª vela
- A 1ª vela fecha abaixo da mínima da 2ª vela
- A 2ª vela é destacada como uma zona potencial de resistência
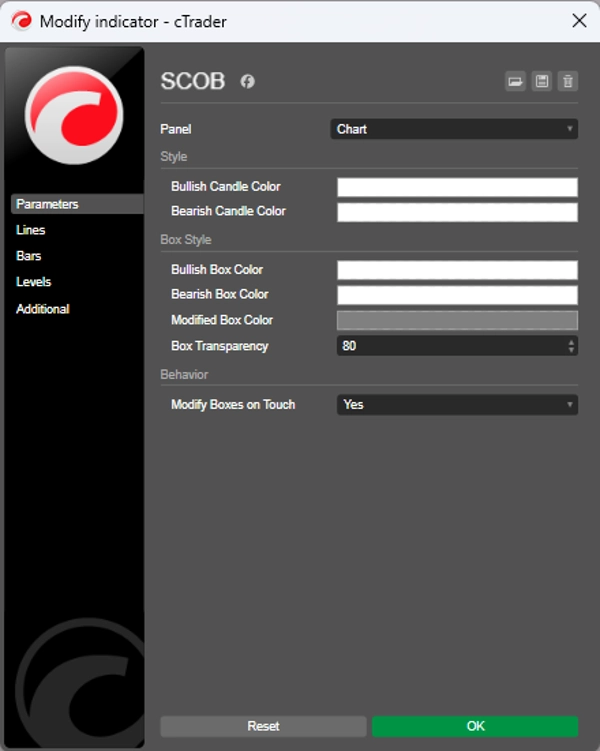
Configurações
Cor da Vela de Alta - Escolha a cor de destaque para padrões SCOB de alta (Padrão: Branco)
Cor da Vela de Baixa - Escolha a cor de destaque para padrões SCOB de baixa (Padrão: Amarelo)
Dicas de Uso
- Use padrões SCOB para identificar zonas potenciais de entrada
- Combine com outras ferramentas de análise técnica para confirmação
- A vela destacada representa um nível institucional chave
- Sempre negocie com a tendência para configurações de maior probabilidade
- Pode ser usado em qualquer período de tempo baseado na sua estratégia de negociação
- Melhor prática: Marque padrões SCOB em períodos maiores (H1, H4, Diário) e negocie na direção da tendência.
Resumo
Perfil do indicador
Avaliações de clientes
4.5
Avaliações: 2
5 | 50 % | |
4 | 50 % | |
3 | 0 % | |
2 | 0 % | |
1 | 0 % |
Avaliações de clientes
October 3, 2025
Helps more when the trader avoids forced trades. It should not replace the chart.
Conversa
Perguntas frequentes
BTCUSD
Forex
Indices
EURUSD
Commodities
GBPUSD
Prop
Scalping
SMC
Crypto
Stocks
XAUUSD
NAS100
USDJPY
Os produtos disponíveis através da cTrader Store, incluindo bots de negociação, indicadores e plugins, são fornecidos por programadores terceiros e são disponibilizados apenas para fins informativos e de acesso técnico. A cTrader Store não é um corretor e não fornece aconselhamento em matéria de investimento, recomendações pessoais ou qualquer garantia de desempenho no futuro.


Preço
Desde 05/01/2025
14
Vendas