
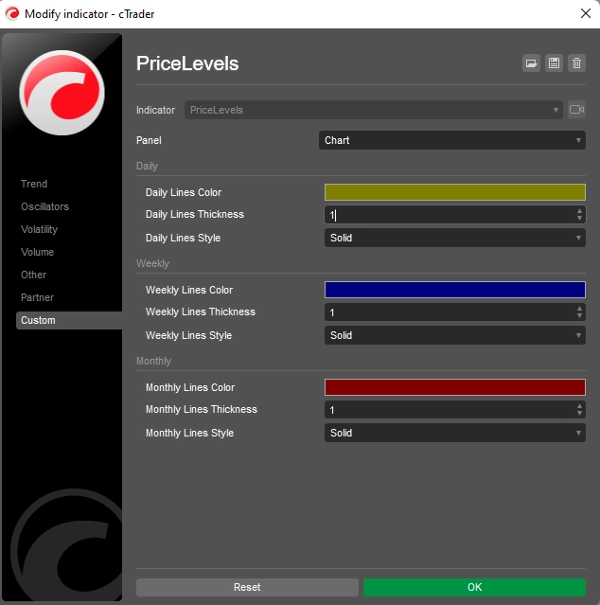
PriceLevels
Wskaźnik
4 zakupy
Wersja 1.0, Jan 2025
Windows, Mac
5.0
Opinie: 2
Opis
Kluczowe cechy:
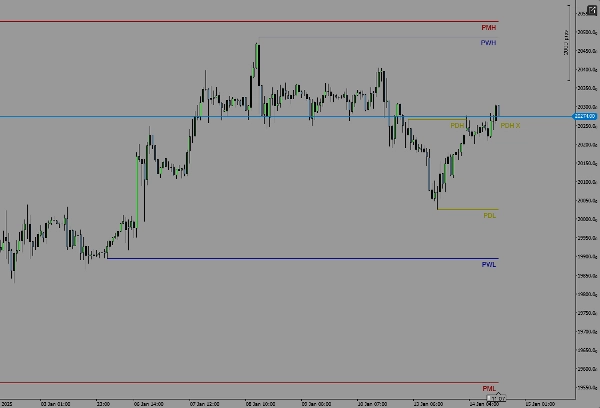
- Wyświetla wczorajsze poziomy maksymalne i minimalne.
- Wyświetla maksymalne i minimalne poziomy z zeszłego tygodnia.
- Wyświetla maksymalne i minimalne poziomy z zeszłego miesiąca.
- Możliwość dostosowania kolorów i stylów linii dla każdego poziomu.
Jak to działa:
Wskaźnik automatycznie oblicza najwyższe i najniższe ceny z poprzedniego dnia, tygodnia i miesiąca na podstawie interwału czasowego Twojego wykresu. Poziomy te są następnie nanoszone jako linie poziome na wykresie, zapewniając wyraźny wizualny punkt odniesienia dla historycznych ruchów cen.
Kompatybilność:
- Przeznaczony wyłącznie dla platformy cTrader.
- Działa na wszystkich interwałach czasowych i instrumentach.
Jeśli masz jakiekolwiek pytania, uwagi lub sugestie dotyczące ulepszeń, nie wahaj się skontaktować! Twoja opinia jest bardzo cenna i pomoże uczynić ten wskaźnik jeszcze lepszym.
Udanych transakcji!
Podsumowanie
Podsumowanie AI
PriceLevels is an indicator designed for the cTrader platform that automatically calculates and displays key historical price levels on trading charts. It plots the highest and lowest prices from the previous day, last week, and last month as horizontal lines, providing traders with clear visual references for past price action. The indicator supports all timeframes and instruments available on cTrader. Users can customize the colors and line styles for each displayed level to suit their charting preferences. This tool aids in identifying significant support and resistance zones based on recent historical data.
Profil wskaźnika
Opinie klientów
5.0
Opinie: 2
5 | 100 % | |
4 | 0 % | |
3 | 0 % | |
2 | 0 % | |
1 | 0 % |
Dyskusja
Częste pytania
Produkty dostępne za pośrednictwem cTrader Store, w tym boty handlowe, wskaźniki i wtyczki, dostarczane są przez deweloperów zewnętrznych i udostępniane wyłącznie w celach informacyjnych oraz w celu zapewnienia dostępu technicznego. cTrader Store nie jest brokerem i nie zapewnia doradztwa inwestycyjnego, nie udziela spersonalizowanych rekomendacji ani nie gwarantuje przyszłych wyników.


Cena
Od 05/01/2025
14
Sprzedaż