
설명
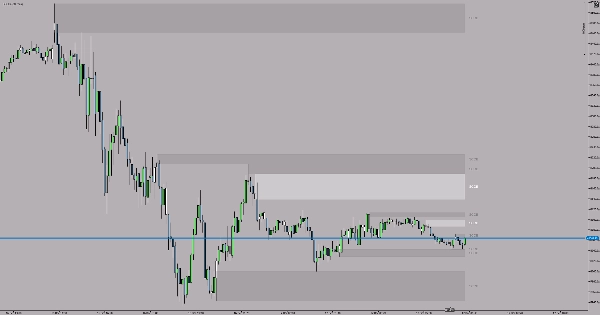
SCOB(싱글 캔들 오더 블록) 지표는 차트에서 강력한 오더 블록 패턴을 자동으로 식별하고 강조 표시합니다. 이 간단하면서도 효과적인 도구는 트레이더가 강력한 기관 활동을 자주 나타내는 주요 반전 패턴을 발견하는 데 도움을 줍니다.
SCOB란 무엇인가요?
SCOB는 잠재적 반전 구역을 나타내는 세 개의 캔들 패턴입니다:
강세 SCOB:
- 두 번째 캔들이 세 번째 캔들보다 더 낮은 저점을 만듭니다
- 첫 번째 캔들의 저점은 두 번째 캔들의 저점 위에 있습니다
- 첫 번째 캔들이 두 번째 캔들의 고점 위에서 마감합니다
- 두 번째 캔들이 강조 표시됩니다 잠재적 지지 구역으로
약세 SCOB:
- 두 번째 캔들이 세 번째 캔들보다 더 높은 고점을 만듭니다
- 첫 번째 캔들의 고점은 두 번째 캔들의 고점 아래에 있습니다
- 첫 번째 캔들이 두 번째 캔들의 저점 아래에서 마감합니다
- 두 번째 캔들이 강조 표시됩니다 잠재적 저항 구역으로
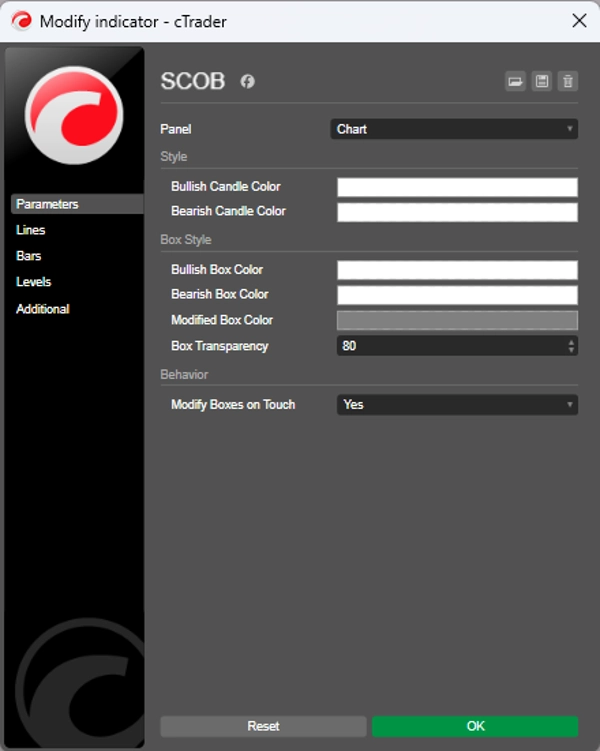
설정
강세 캔들 색상 - 강세 SCOB 패턴의 강조 색상을 선택하세요 (기본값: 흰색)
약세 캔들 색상 - 약세 SCOB 패턴의 강조 색상을 선택하세요 (기본값: 노란색)
사용 팁
- SCOB 패턴을 사용하여 잠재적 진입 구역을 식별하세요
- 확인을 위해 다른 기술 분석 도구와 결합하세요
- 강조된 캔들은 주요 기관 수준을 나타냅니다
- 더 높은 확률 설정을 위해 항상 추세와 함께 거래하세요
- 거래 전략에 따라 모든 타임프레임에서 사용할 수 있습니다
- 최고의 방법: 높은 타임프레임(H1, H4, 일간)에서 SCOB 패턴을 표시하고 추세 방향으로 거래하세요.
요약
지표 프로필
고객 리뷰
4.5
리뷰: 2
5 | 50 % | |
4 | 50 % | |
3 | 0 % | |
2 | 0 % | |
1 | 0 % |
고객 리뷰
October 3, 2025
Helps more when the trader avoids forced trades. It should not replace the chart.
상담
자주 묻는 질문(FAQ)
BTCUSD
Forex
Indices
EURUSD
Commodities
GBPUSD
Prop
Scalping
SMC
Crypto
Stocks
XAUUSD
NAS100
USDJPY
트레이딩 봇, 지표, 플러그인 등 cTrader Store에서 제공되는 상품은 제3자 개발자에 의해 제공되며, 이는 단순히 정보 및 기술적 접근을 목적으로 제공된 것입니다. cTrader Store는 중개인이 아니며, 투자 조언, 개인별 추천 또는 향후 성과에 대한 어떠한 보장도 제공하지 않습니다.


가격
가입일 05/01/2025
14
판매