
Vision - Advanced Session Indicator
지표
6 구매
버전 1.0, Jul 2025
Windows, Mac
5.0
리뷰: 2
설명
고급 세션 표시기
설명:
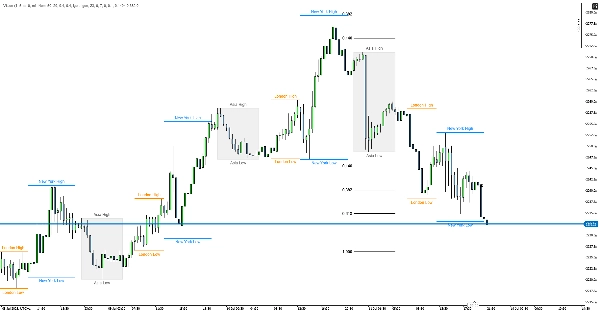
주요 거래 세션의 가격 범위를 표시하고 각 세션에 대한 거래량 프로필 분석을 추가하는 cTrader용 전문 세션 표시기입니다.
주요 기능:
📊 세션 가격 박스 및 선
- 4개의 주요 거래 세션: 아시아, 프랑크푸르트, 런던, 뉴욕
- 완전한 맞춤형 시간 설정: 각 세션별로 개별 설정 가능
- 색상 코드화된 가격 범위 박스 및 선: 각 세션의 고가/저가 값을 시각적으로 표시
- 자동 시간대 처리
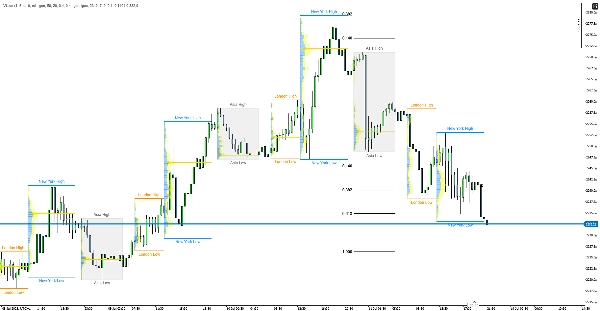
📈 세션 거래량 프로필
- 거래량 분포 표시: 각 세션별 별도의 거래량 프로필
- 매수/매도 거래량: 별도의 색상(파랑/노랑)
- POC (통제점): 가장 높은 거래량 가격 수준 표시
- 맞춤형 해상도: 10-500 레벨 거래량 히스토그램
설정
세션 시간
- 아시아: 23:00-07:00 (회색)
- 프랑크푸르트: 07:00-08:00 (진한 녹색)
- 런던: 09:00-14:00 (주황색)
- 뉴욕: 14:00-22:00 (파랑)
맞춤형 옵션
- 박스 및 선 투명도와 색상
- 아시아 세션 연장 변형
- 거래량 히스토그램 너비 및 투명도
- 표시할 일수
- POC 선 표시
- 세션 박스와 거래량 프로필에 대한 별도의 시간 프레임
사용법
거래 응용:
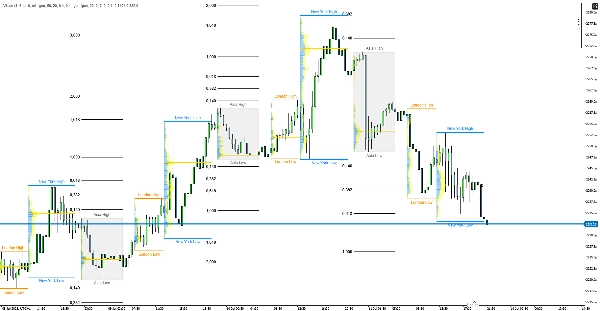
- S/R 포인트로서의 세션 고가/저가 수준
- 중요 수준 표시를 위한 거래량 클러스터
- 자기장 수준으로서의 POC 선
- 중요도가 강조된 세션 중첩
장점: 가격 움직임과 거래량 분석의 결합, 실시간 업데이트, 완전한 맞춤화, 전문적인 외관.
요약
AI 요약
Vision - Advanced Session Indicator is a professional tool designed for the cTrader platform to visualize and analyze major trading sessions: Asia, Frankfurt, London, and New York. It displays session price ranges using color-coded boxes and lines, highlighting high and low values for each session. The indicator supports full customization of session times, colors, transparency, and display settings, including separate timeframes for session boxes and volume profiles.
Key features include a session volume profile that shows volume distribution with distinct buy/sell volume colors and marks the Point of Control (POC), the price level with the highest traded volume. Users can customize the volume histogram resolution from 10 to 500 levels. The indicator automatically handles time zones and adjusts for Daylight Saving Time to ensure accurate session tracking.
Vision aids traders by marking session high/low levels as support and resistance points, identifying volume clusters and liquidity zones, and highlighting session overlaps. It is particularly useful for day traders seeking detailed insights into market behavior and potential entry levels based on volume and price action across different trading sessions.
지표 프로필
고객 리뷰
5.0
리뷰: 2
5 | 100 % | |
4 | 0 % | |
3 | 0 % | |
2 | 0 % | |
1 | 0 % |
고객 리뷰
July 27, 2025
The entry needs one more reason to make sense, but the market context still matters.
July 15, 2025
The practical angle is weak trade ideas become less attractive, and signal count matters more than one nice example.
상담
자주 묻는 질문(FAQ)
Prop
Forex
Indices
Crypto
트레이딩 봇, 지표, 플러그인 등 cTrader Store에서 제공되는 상품은 제3자 개발자에 의해 제공되며, 이는 단순히 정보 및 기술적 접근을 목적으로 제공된 것입니다. cTrader Store는 중개인이 아니며, 투자 조언, 개인별 추천 또는 향후 성과에 대한 어떠한 보장도 제공하지 않습니다.


가격
가입일 05/01/2025
14
판매