
설명
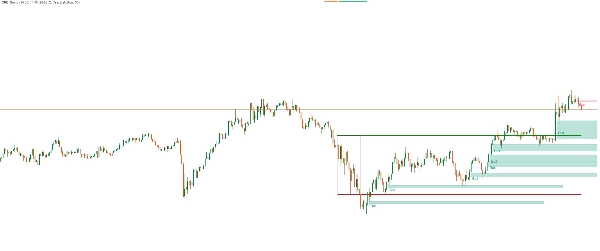
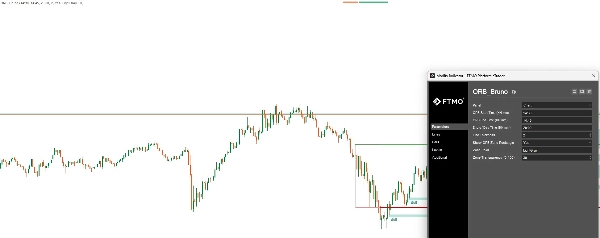
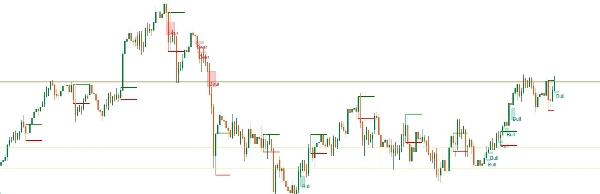
이 지표는 개장 범위 돌파(ORB) 거래 전략을 구현하여 거래 세션 중 가장 변동성이 큰 기간 동안 모멘텀을 포착하도록 설계되었습니다. 사용자 정의 시간 매개변수를 기반으로 개장 범위를 식별하고 잠재적 진입 신호를 위한 돌파 수준을 표시합니다. 이 전략은 시장이 초기 범위를 상향 또는 하향 돌파할 때 가격 움직임을 활용하는 것을 목표로 하며, 이는 종종 강한 방향성 추세를 나타냅니다.
주요 특징:
- 사용자 정의 가능한 개장 범위 시간 창
- 돌파 수준의 자동 계산
- 돌파 확인을 위한 시각적 알림
- 여러 시간대 및 상품에 적용 가능
- 높은 확률의 설정을 찾는 당일 거래자에게 이상적
작동 방식:
- 지정된 기간 동안 개장 범위(고가 및 저가)를 정의합니다.
- 이 범위를 넘어서는 돌파를 위해 가격 움직임을 모니터링합니다.
- 돌파 방향 및 선택적 필터(예: 거래량, 변동성)를 기반으로 거래 신호를 생성합니다.
요약
AI 요약
ORB_BRSTrading is an indicator implementing an Opening Range Breakout (ORB) trading strategy aimed at capturing momentum during the most volatile period of a trading session. It defines the opening range high and low based on user-specified time parameters and automatically calculates breakout levels. The indicator monitors price action for breakouts beyond this range and generates trade signals according to breakout direction, with optional filters such as volume or volatility. It provides visual alerts to confirm breakouts and supports multiple timeframes and instruments, making it suitable for intraday traders seeking high-probability setups. The strategy is applicable across various markets including Forex, stocks, indices, and symbols like BTCUSD, EURUSD, GBPUSD, XAUUSD, NAS100, and USDJPY.
지표 프로필
고객 리뷰
4.6
리뷰: 3
5 | 67 % | |
4 | 33 % | |
3 | 0 % | |
2 | 0 % | |
1 | 0 % |
고객 리뷰
February 9, 2026
ORB_BRSTrading is a solid Opening Range Breakout tool. Clean visuals and reliable logic make it work best on M10-H4. Great for intraday and session-based breakout strategies. Less effective on very low or very high timeframes.
December 10, 2025
December 2, 2025
상담
자주 묻는 질문(FAQ)
BTCUSD
Forex
Breakout
Indices
EURUSD
GBPUSD
NZDUSD
Stocks
XAUUSD
NAS100
USDJPY
트레이딩 봇, 지표, 플러그인 등 cTrader Store에서 제공되는 상품은 제3자 개발자에 의해 제공되며, 이는 단순히 정보 및 기술적 접근을 목적으로 제공된 것입니다. cTrader Store는 중개인이 아니며, 투자 조언, 개인별 추천 또는 향후 성과에 대한 어떠한 보장도 제공하지 않습니다.
이 작성자의 상품 더 보기

좋아하실 만한 다른 항목


가격
가입일 22/10/2025
303.42M
거래량
49
핍 수익
1
판매