
support and resistance
Wskaźnik
13 zakupy
Wersja 1.0, Jun 2025
Windows, Mac
4.3
Opinie: 3
Opis
Kluczowe funkcje:
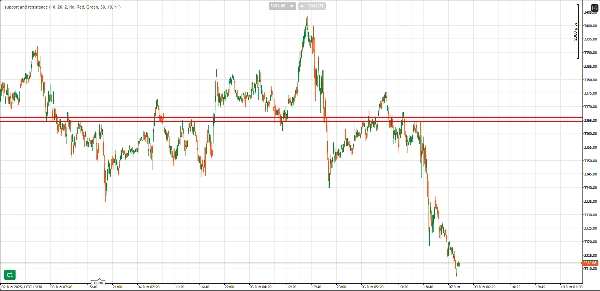
- Automatyczne wykrywanie wsparcia i oporu: Wskaźnik automatycznie identyfikuje istotne poziomy wsparcia i oporu na podstawie ruchu cen, podkreślając te strefy, gdzie cena odwracała się lub zatrzymywała wielokrotnie.
- Weryfikacja liczby odbić: Poziomy wsparcia i oporu są weryfikowane na podstawie liczby odbić (reakcji ceny) od poziomu. Im więcej odbić, tym silniejszy poziom. Możesz dostosować minimalną liczbę odbić, aby poziom był uznany za ważny, zapewniając, że oznaczone są tylko poziomy o dużym znaczeniu.
- Regulowane style linii: Grubość i styl linii wsparcia i oporu są automatycznie dostosowywane na podstawie liczby odbić. Poziomy z większą liczbą odbić są rysowane grubszymi, bardziej wyraźnymi liniami, wizualnie podkreślając ich znaczenie.
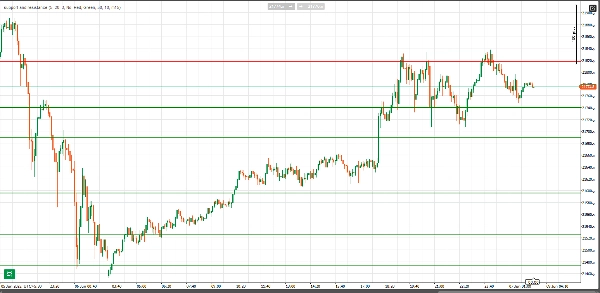
- Szerokość strefy (pipsy): Możesz zdefiniować strefę buforową wokół poziomów wsparcia i oporu w pipsach. Pomaga to w identyfikacji ruchu cen w zakresie, gdzie cena może potencjalnie się odwrócić lub zareagować.
- Filtr wyższego interwału czasowego: Unikalną cechą tego wskaźnika jest jego zdolność do weryfikacji poziomów wsparcia i oporu za pomocą filtru wyższego interwału czasowego. Wybierając wyższy interwał (np. 1H, 4H), wskaźnik porównuje zidentyfikowane poziomy z kluczowym ruchem cen na wyższym interwale, zapewniając, że na wykresie rysowane są tylko istotne poziomy.
- Alerty: Gdy cena wchodzi w strefę poziomu wsparcia lub oporu, wskaźnik może powiadomić Cię dźwiękiem, abyś nigdy nie przegapił ważnej reakcji cenowej.
- Konfigurowalne kolory: Możesz łatwo zmienić kolor linii wsparcia i oporu, aby dopasować je do swoich preferencji lub stylu handlu.
- Zapobieganie nakładaniu się: Wskaźnik zawiera filtr progowy, który zapobiega rysowaniu nakładających się poziomów wsparcia i oporu zbyt blisko siebie, zapewniając wyświetlanie tylko unikalnych i ważnych poziomów.
Korzyści:
- Oszczędność czasu: Automatycznie wykrywaj i wizualizuj kluczowe poziomy wsparcia i oporu bez konieczności ręcznego ich rysowania.
- Wyraźna wizualizacja: Łatwo zobacz, które poziomy wsparcia i oporu są najbardziej istotne na podstawie odbić cen i weryfikacji na wyższym interwale czasowym.
- Skuteczne alerty: Otrzymuj terminowe powiadomienia, gdy ruch cenowy wchodzi w ważne poziomy, co pomaga działać szybko i efektywnie.
- Lepsze decyzje handlowe: Używaj tego wskaźnika, aby zyskać większą pewność przy wejściach i wyjściach oraz w ogólnej analizie technicznej.
Opcje dostosowania:
- Liczba słupków wstecz: Dostosuj, jak daleko wskaźnik patrzy wstecz, aby zidentyfikować potencjalne poziomy wsparcia i oporu.
- Minimalna liczba odbić: Ustaw minimalną liczbę odbić wymaganą, aby poziom był uznany za ważny.
- Wyższy interwał czasowy: Filtruj poziomy wsparcia i oporu na podstawie wyższego interwału czasowego (np. wykresy 1-godzinne, 4-godzinne).
- Kolor linii: Wybierz kolory linii oporu i wsparcia, aby dopasować je do stylu wykresu.
- Ustawienia alertów: Włącz lub wyłącz alerty w zależności od wejścia ceny w strefy wsparcia lub oporu.
Podsumowanie
Podsumowanie AI
This indicator automatically detects key support and resistance levels by analyzing price action and identifying zones where price has reversed or stalled multiple times. It validates these levels based on the number of price bounces, allowing users to set a minimum bounce count to highlight only significant levels. The indicator visually emphasizes stronger levels by adjusting line thickness and style according to bounce count. Users can define a buffer zone around levels in pips to capture price reactions within a range.
A higher timeframe filter cross-checks identified levels against price action on selected higher timeframes (e.g., 1-hour, 4-hour), ensuring only important levels are displayed. Alerts notify users with audio signals when price enters support or resistance zones. The indicator prevents overlapping lines by applying a threshold filter, maintaining clarity on the chart. Colors of support and resistance lines are customizable to fit user preferences.
Customization options include adjusting lookback bars, minimum bounces, higher timeframe selection, line colors, and alert settings. This tool supports markets such as Forex, commodities, indices, and popular symbols including BTCUSD, EURUSD, GBPUSD, XAUUSD, NAS100, and USDJPY. It aids traders in saving time, improving visual clarity, receiving timely alerts, and making more confident trading decisions.
Profil wskaźnika
Kategoria wskaźnika
Wsparcie i opór
Typ wyjścia
Wizualizacja
Wymagania dotyczące danych
Tylko słupki
Obsługiwane sygnały
Przełamanie
Odwrócenie trendu
Opinie klientów
4.3
Opinie: 3
5 | 33 % | |
4 | 67 % | |
3 | 0 % | |
2 | 0 % | |
1 | 0 % |
Opinie klientów
June 11, 2025
Nice setup companion for a more controlled workflow. It helps with planning entries and exits around important areas, but not every zone holds, even if it looks clean. The cleanest use is 3 to 5 levels per chart, with 0.5 pullbacks checked before entry. I would still keep manual review in the process.
June 10, 2025
June 10, 2025
Decent option for checks around key price zones. The useful part is planning entries and exits around important areas, with the numbers checked before scaling. I would wait for 2 reactions and avoid trades where the target is less than 1.5R. Levels are useful when they reduce noise, not when they crowd the chart.
Dyskusja
Częste pytania
BTCUSD
Prop
Forex
Breakout
Indices
EURUSD
Commodities
GBPUSD
NZDUSD
XAUUSD
NAS100
USDJPY
Produkty dostępne za pośrednictwem cTrader Store, w tym boty handlowe, wskaźniki i wtyczki, dostarczane są przez deweloperów zewnętrznych i udostępniane wyłącznie w celach informacyjnych oraz w celu zapewnienia dostępu technicznego. cTrader Store nie jest brokerem i nie zapewnia doradztwa inwestycyjnego, nie udziela spersonalizowanych rekomendacji ani nie gwarantuje przyszłych wyników.


Cena
Od 30/05/2025
40
Sprzedaż