Opis
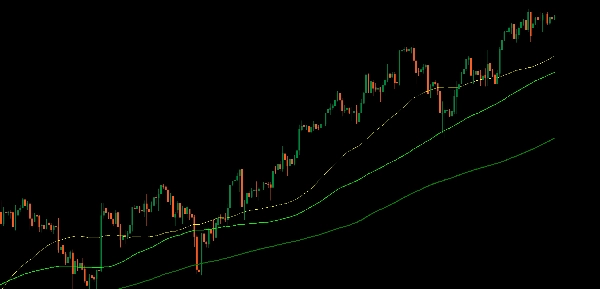
Przedstawiamy ulepszony Wskaźnik Średniej Kroczącej, zaprojektowany z myślą o lepszej personalizacji i elastyczności w Twojej analizie handlowej.
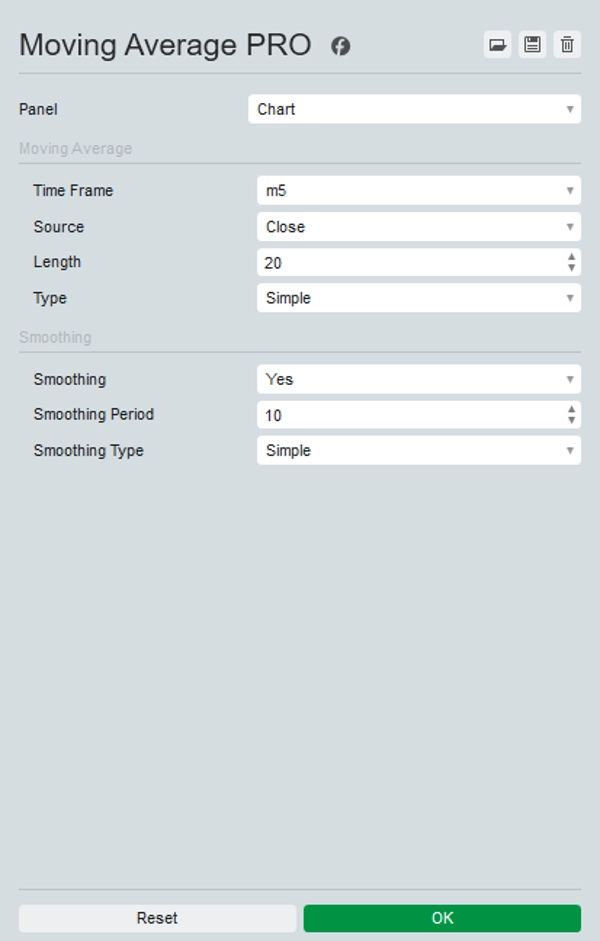
Ta ulepszona wersja obsługuje również średnie kroczące z wyższych interwałów czasowych do interwałów tick i Heikin Ashi. Okresy Renko i Range nie są jeszcze obsługiwane.
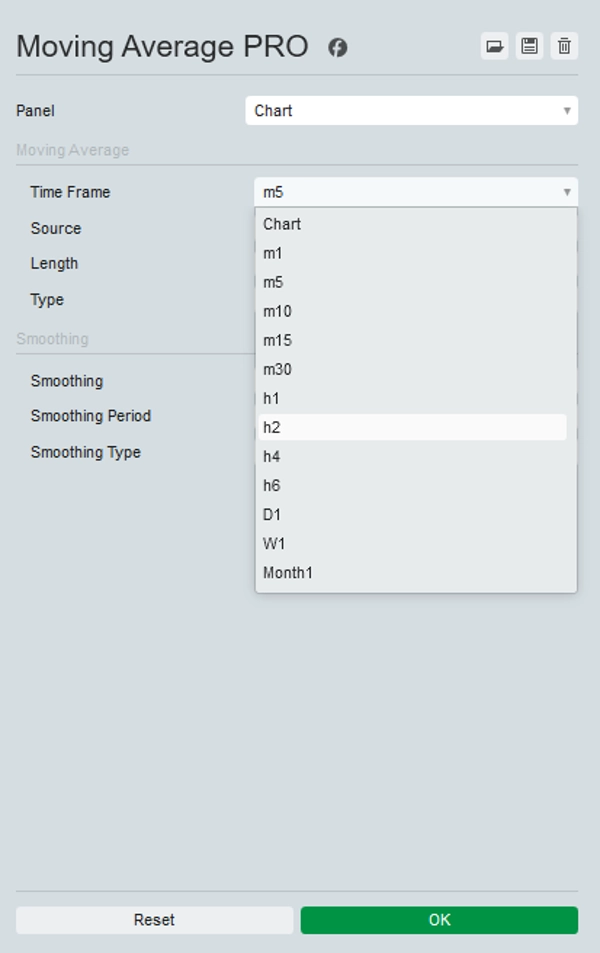
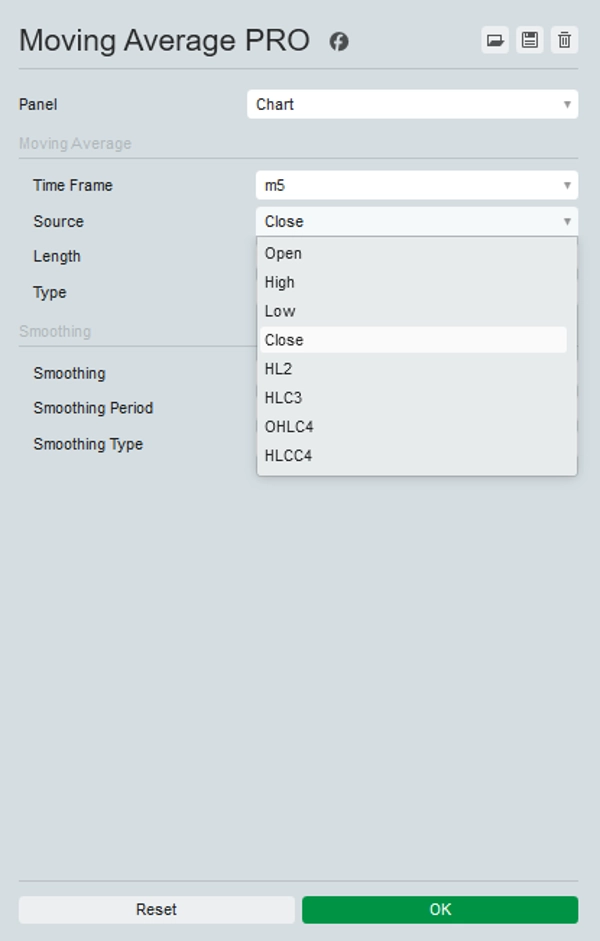
Ten wskaźnik pozwala wybrać dowolny interwał czasowy, umożliwiając wyświetlenie na przykład dziennej 200 MA na dowolnym innym interwale.
Dodatkowo oferuje wybór różnych źródeł cen, w tym Open, High, Low, Close, HL2, HLC3, OHLC4 oraz HLCC4, tak jak w TradingView, oraz opcjonalne opcje wygładzania, aby rozwiązać problemy z próbkowaniem na niższych interwałach.
Dzięki tym opcjom możesz dostosować Średnią Kroczącą do swojej konkretnej strategii handlowej i uzyskać bardziej precyzyjne informacje o trendach rynkowych.
Ulepsz swoje narzędzia handlowe dzięki ulepszonemu wskaźnikowi Średniej Kroczącej dla lepszej analizy i podejmowania decyzji.
Podsumowanie
Opinie klientów
5 | 100 % | |
4 | 0 % | |
3 | 0 % | |
2 | 0 % | |
1 | 0 % |