

present
Registrieren Sie sich und erhalten Sie $50 Rabatt auf Ihren ersten Kauf
Trading product for Liquidity Sweep Tracker Indikator Double Top AI-assisted, image 1
Liquidity Sweep Tracker
Indikator
Version 1.0, Aug 2026
Windows, Mac
Trading product for Liquidity Sweep Tracker Indikator Double Top AI-assisted, image 2
Trading product for Liquidity Sweep Tracker Indikator Double Top AI-assisted, image 3
Trading product for Liquidity Sweep Tracker Indikator Double Top AI-assisted, image 4
Trading product for Liquidity Sweep Tracker Indikator Double Top AI-assisted, image 5
Trading product for Liquidity Sweep Tracker Indikator Double Top AI-assisted, image 6
Trading product for Liquidity Sweep Tracker Indikator Double Top AI-assisted, image 7
Seit 07/05/2026
5
Verkäufe
63
Kostenlose Installationen

Beschreibung

Equal Highs und Equal Lows sind derzeit eines der meistdiskutierten Liquiditätskonzepte im Trading — die Idee, dass der Preis statistisch dazu neigt, offensichtliche Doppelhochs und Doppeltiefs anzusteuern, bevor er sich umkehrt, weil genau dort die Stop-Losses von Privatanlegern und Breakout-Orders konzentriert sind. Die meisten Versionen dieses Konzepts existieren nur versteckt als kleines Feature innerhalb großer All-in-One Smart Money Concepts-Suiten. Dies ist ein dediziertes, eigenständiges Tool, das genau diese eine Aufgabe richtig erfüllt.


**Was es analysiert:** jeden Swing High und Swing Low im Chart, wobei solche, die ungefähr auf dem gleichen Niveau liegen (innerhalb deiner Toleranz), zu einem einzigen Liquiditätspool zusammengefasst werden. Jeder Pool verfolgt, wie oft er getestet wurde — ein Level, das dreimal berührt wurde, hat mehr Gewicht als eines, das nur einmal berührt wurde.


**Wie man es liest:**

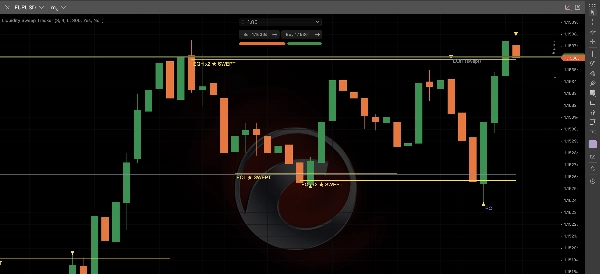
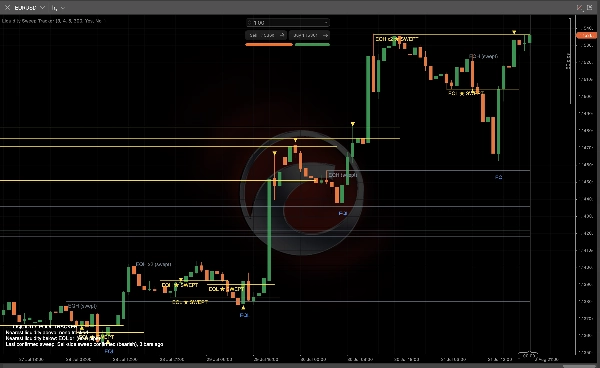
- **Gestrichelte Linien** sind ruhende Liquiditätspools — noch nicht gesweept, weiterhin aktive Ziele.

- **Graue durchgezogene Linien** bedeuten, dass der Pool gesweept wurde (der Preis hat ihn durchlaufen), aber keine bestätigende Reaktion erfolgte — wahrscheinlich nur ein sauberer Ausbruch, keine Umkehr.

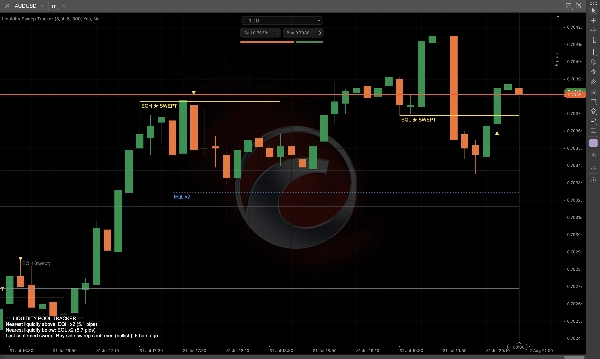
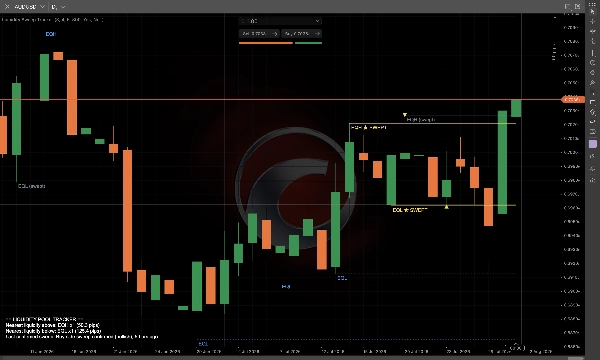
- **Goldene leuchtende Linien mit Dreieck-Markierung** bedeuten, dass der Sweep **bestätigt** wurde: Der Preis hat den Pool durchlaufen und ist dann innerhalb des Reaktionsfensters auf die andere Seite zurückgekehrt — das tatsächliche Umkehr-Signatur-Liquiditäts-Sweep, nach dem Trader suchen.

- Labels zeigen auf einen Blick den Pool-Typ (EQH/EQL), die Anzahl der Berührungen (z.B. „EQH x3“) und den aktuellen Status.

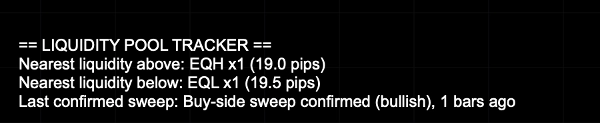
- Ein Live-Panel zeigt die nächstgelegene unberührte Liquidität ober- und unterhalb des aktuellen Preises (mit Pip-Distanz) sowie den zuletzt bestätigten Sweep.


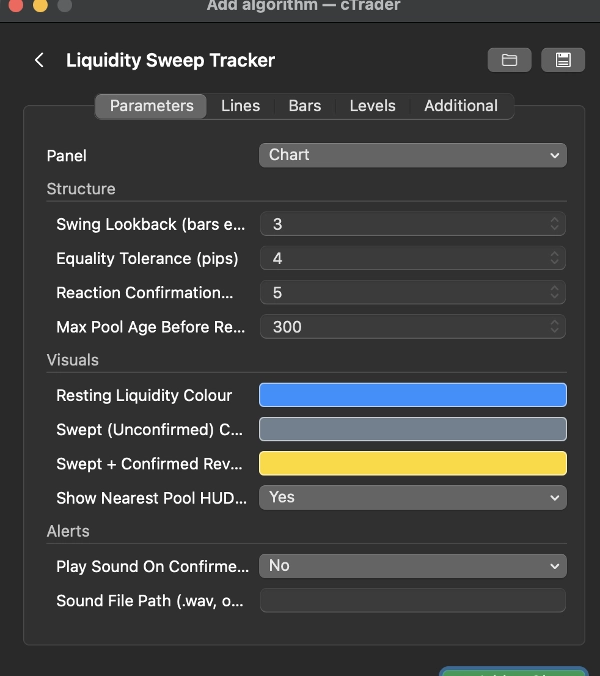
**Wichtige Einstellungen:** Gleichheitstoleranz (wie nah zwei Hochs/Tiefs beieinanderliegen müssen, um als gleich zu gelten), Swing-Empfindlichkeit und das Reaktionsbestätigungsfenster (wie viele Kerzen der Preis zurück durch das Level schließen muss, um als echte Umkehr und nicht als Ausbruch zu gelten).


**Typische Anwendungsfälle:** Erkennen, welchen Liquiditätspool der Preis wahrscheinlich als nächstes ansteuert; Unterscheidung eines echten Umkehr-Sweeps von einem Level, das nur durchbrochen und weitergelaufen ist; Verwendung der Berührungsanzahl als groben Stärke-Filter (mehr Berührungen = mehr ruhende Liquidität); Kombination bestätigter Sweeps mit eigener Struktur- oder Einstiegsmodell.


**Am besten geeignet für:** Trader, die Liquidität, Smart Money Concepts oder ICT-ähnliche Preisaktionen als Teil ihres Prozesses nutzen und eine dedizierte, übersichtliche Darstellung von EQH/EQL wünschen, anstatt ein verstecktes Feature in einem 12-in-1-All-in-One-Indikator.

Zusammenfassung

KI-Zusammenfassung
Liquidity Sweep Tracker is a standalone trading indicator focused on identifying and confirming genuine liquidity sweeps at Equal Highs (EQH) and Equal Lows (EQL). It analyzes every swing high and low on the chart, grouping those at similar price levels into liquidity pools and tracking how often each pool is tested. The indicator visually distinguishes between resting liquidity pools (dotted lines), swept but unconfirmed pools (grey solid lines), and confirmed sweeps that signal genuine reversals (gold glowing lines with triangle markers). Labels provide quick reference to pool type, touch count, and status. A live panel displays the nearest untouched liquidity pools above and below the current price, along with the most recent confirmed sweep. Key configurable settings include equality tolerance, swing sensitivity, and the reaction confirmation window, which defines how many bars price must close beyond a level to confirm a reversal. This tool is suited for traders employing liquidity concepts, Smart Money Concepts, or ICT-style price action, offering a focused and uncluttered approach to tracking EQH/EQL liquidity sweeps. Typical use cases include identifying likely next liquidity targets, distinguishing true reversal sweeps from breakouts, and using touch count as a strength filter to inform trading decisions.
Indikatorprofil
Indikatorkategorie
Trend
Ausgabetyp
Visualisierung
Signale
Datenanforderungen
Tick-Daten
Nur Balken
Unterstützte Signale
Ausbruch
Wendepunkt
Trendstärke
Volatilität
Eröffnungsspanne der Sitzung

Kundenbewertungen

0.0
Bewertungen: 0
Kundenbewertungen
Bisher gibt es keine Bewertungen für dieses Produkt. Haben Sie es schon ausprobiert? Dann können Sie die erste Person sein, die andere darüber informiert!

Diskussion

Häufig gestellte Fragen (FAQ)

Double Top
AI-assisted
Liquidity Sweep
Market Structure
Double Bottom
Liquidity Grab
Triangle
Über den cTrader Store verfügbare Produkte, einschließlich Handelsbots, Indikatoren und Plugins, werden von externen Entwicklern bereitgestellt und nur zu Informations- und technischen Zugriffszwecken verfügbar gemacht. cTrader Store ist kein Broker und erbringt keine Anlageberatung, persönlichen Empfehlungen oder eine Garantie für zukünftige Performance.

Mehr von diesem Autor

Multi-Plattform-Plugin
News Filter
Risk Alerts
+5
Smart Money Concepts and ICT Trading Analytics Platform. Daily bias estimator, ICT strategty checker, TP and SL.
Indikator
AI-assisted
Order Block
+5
The daily bias estimator indicator uses ICT concepts to show whether the chart is bullish or bearish on multi-time frame
Indikator
ATR
BOS
+5
Full ICT/SMC 4-step setup checker that alerts a long or short setup.
Indikator
Volume
Fibonacci
+5
Classic 9:30 Opening Range Breakout — auto-plots the range, flags volume-confirmed breakouts long or short, live.
Indikator
Flag
VWAP
+5
Session VWAP with statistical deviation bands, gradient cloud, and live rejection alerts — see exactly how stretched pri
Indikator
MSS
AI-assisted
+5
Live ICT Silver Bullet detection: liquidity sweeps, structure shifts, and killzone-gated FVGs, graded and glowing in rea
Indikator
ATR
Key Levels
+5
CPR indicator that actually predicts the day ahead: width percentile scoring for breakout-day detection
Indikator
BOS
EMA
+5
Directional volume heatmap: see if a price zone was built on buying or selling, not just how much.
Indikator
ATR
MSS
+5
Grades ICT Unicorn setups (Breaker Block + FVG confluence) into PRIME / SETUP / WATCH, with retest & RR targets.
Indikator
BOS
Volume
+5
20/40/60-day IPDA lookback ranges, Premium/Discount/Equilibrium zones, and quarterly shift alerts — anchored to true dai
Indikator
BOS
MSS
+5
One indicator, full ICT/SMC picture — structure, OBs, FVGs, liquidity, Premium/Discount — with graded PRIME/SETUP signal

Das könnte Sie auch noch interessieren

Indikator
AI
BOS
+4
Golden Boom and Crash Spike Detector is a trading tool designed for Crash 300 and Boom 300 indices on M1 Timeframe.
Indikator
BOS
Volume
+5
The Volume Delta Indicator using Institutional Level 2 DOM Data, The Edge Institutions Pay Millions For, now on cTrader
Indikator
BOS
CHOCH
+5
A professional-grade cTrader indicator for traders following the Inner Circle Trader (ICT) methodology.
Indikator
A compact, visual multi-timeframe trend indicator for cTrader. Easily spot bullish or bearish trends across 4 customizab
Indikator
Key Levels
Market Structure
+1
HTF Candle Projector displays the current Higher Timeframe candle (4H or 1H) as a real projected candle LIVE..
Indikator
Prop
Forex
+13
Unlock trading precision with QQE! Dual QQE indicators with a Bollinger Bands zero line provide clear buy/sell signals.
Indikator
This indicator is a valuable tool for traders looking to identify significant opening price level of any asset.
Indikator
Spot Strong Trends Early & Filter Market Noise
Indikator
ATR
Channel
Reversal Trap Probability Bands plots a dynamic volatility envelope around price & automatically detects "trap" reversal
Indikator
ATR
RSI
+17
Turn data into precision trades with AlphaTrend Pro Max — advanced trend, signal & structure analysis in one.
Indikator
The Weekly Daily Levels indicator shows the OHLC, and mid-point prices for the previous day and week.
Indikator
EMA
Channel
+5
⚡ Institutional Nasdaq (NQ/US100) Trend Engine: Adaptive M1–D1 EMA alignment, chop slope filters, zero-clutter symbols &
Indikator
Signal
USDJPY
See USD demand in one line—Composite OBV fuses six major FX pairs into a clear momentum gauge.
Indikator
Forex
BTCUSD
+6
Multi-pole Gaussian filter channel with dynamic color, Reduced Lag & Fast Response modes. Port of DonovanWall's original
Indikator
Spread Filter
SpreadSync Entry Timer is a compact cTrader indicator that shows live spread and candle-close.
Indikator
ATR
MSS
+5
Grades ICT Unicorn setups (Breaker Block + FVG confluence) into PRIME / SETUP / WATCH, with retest & RR targets.
Indikator
MultiTF Pivot and SR Indicator
Indikator
BOS
EMA
+5
Directional volume heatmap: see if a price zone was built on buying or selling, not just how much.

Preis

Seit 07/05/2026
5
Verkäufe
63
Kostenlose Installationen




























