
QQE Qualitative Quantity Estimation
지표
2 구매
버전 1.0, Oct 2025
Windows, Mac
5.0
리뷰: 1
설명
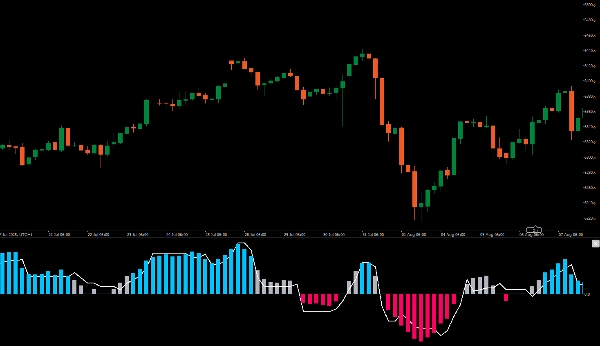
향상된 거래 인사이트를 위해 두 개의 QQE 지표를 결합한 강력한 도구인 고급 QQE(정성적 정량적 추정) 지표를 소개합니다.
하나는 차트에 열로 표시되고, 다른 하나는 50기간 볼린저 밴드를 제로 라인으로 하여 백그라운드에서 작동합니다.
이 설정은 시장 모멘텀을 시각적으로 평가하고 잠재적 진입점을 명확하게 식별할 수 있게 해줍니다. 두 QQE 지표가 일치할 때는 강력한 매수 또는 매도 기회를 알리는 선명한 파란색 또는 빨간색 막대를 볼 수 있습니다.
더 많은 정보에 기반한 결정과 향상된 정확도를 위해 QQE 지표로 거래 전략을 향상시키십시오. 향상된 거래 인사이트를 위해 두 개의 QQE 지표를 결합한 강력한 도구인 고급 QQE(정성적 정량적 추정) 지표를 소개합니다.
하나는 차트에 열로 표시되고, 다른 하나는 50기간 볼린저 밴드를 제로 라인으로 하여 백그라운드에서 작동합니다.
이 설정은 시장 모멘텀을 시각적으로 평가하고 잠재적 진입점을 명확하게 식별할 수 있게 해줍니다. 두 QQE 지표가 일치할 때는 강력한 매수 또는 매도 기회를 알리는 선명한 파란색 또는 빨간색 막대를 볼 수 있습니다.
더 많은 정보에 기반한 결정과 향상된 정확도를 위해 QQE 지표로 거래 전략을 향상시키십시오.
요약
지표 프로필
고객 리뷰
5.0
리뷰: 1
5 | 100 % | |
4 | 0 % | |
3 | 0 % | |
2 | 0 % | |
1 | 0 % |
상담
자주 묻는 질문(FAQ)
BTCUSD
Forex
Signal
Indices
EURUSD
Commodities
GBPUSD
NZDUSD
Bollinger
Prop
Crypto
Stocks
XAUUSD
NAS100
USDJPY
트레이딩 봇, 지표, 플러그인 등 cTrader Store에서 제공되는 상품은 제3자 개발자에 의해 제공되며, 이는 단순히 정보 및 기술적 접근을 목적으로 제공된 것입니다. cTrader Store는 중개인이 아니며, 투자 조언, 개인별 추천 또는 향후 성과에 대한 어떠한 보장도 제공하지 않습니다.


좋아하실 만한 다른 항목


가격
가입일 25/09/2025
25
판매
316
무료 설치