
설명
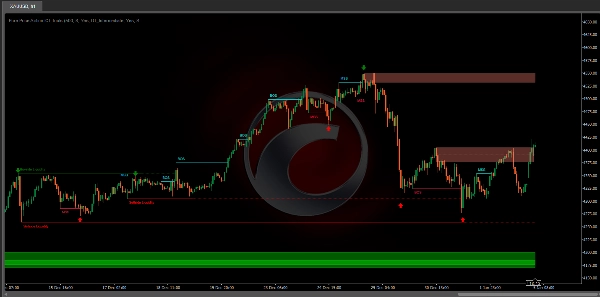
The Pure Price Action ICT Tools 지표는 순수 가격 행동 분석을 위해 설계되었으며, 실시간 시장 구조, 유동성 수준, 주문 및 브레이커 블록, 그리고 유동성 공백을 자동으로 식별합니다.
이 지표의 독특한 특징은 사용자 정의 입력에 제한받지 않고 가격 패턴에만 독점적으로 의존하여 시장 역학을 강력하고 객관적으로 분석한다는 점입니다.
주요 특징
- 시장 구조
시장 구조 전환(Market Structure Shift, MSS) 또는 특성 변화(Change of Character, CHoCH)는 가격 행동 분석에서 중요한 사건으로, 시장 심리나 방향의 잠재적 변화를 나타냅니다. MSS는 가격이 확립된 추세에서 반전할 때 발생하며, 현재 추세가 힘을 잃고 반전이 진행 중일 수 있음을 신호합니다. 이 전환은 하락 추세에서의 더 높은 저점이나 상승 추세에서의 더 낮은 고점과 같은 주요 기술적 패턴으로 종종 식별되며, 이는 현재 추세의 강도가 약화되고 있음을 나타냅니다.
구조 붕괴(Break of Structure, BOS)는 일반적으로 현재 시장 추세의 지속을 나타냅니다. 이 사건은 가격이 이전 스윙 고점 또는 저점을 결정적으로 돌파할 때 발생하며, 현재 추세의 강도를 확인합니다. 상승 추세에서는 가격이 이전 고점을 돌파할 때 BOS가 표시되고, 하락 추세에서는 가격이 이전 저점을 하향 돌파할 때 식별됩니다.
시장 구조 전환(MSS)은 잠재적 추세 반전을 나타낼 수 있고, 구조 붕괴(BOS)는 종종 추세 지속을 확인하지만, 이들이 완전한 반전이나 지속을 보장하지는 않습니다. MSS와 BOS 수준은 시장 방향의 변화를 명확히 신호하기보다는 유동성 영역이나 가격 통합 구간으로 기능할 수도 있습니다. 트레이더는 이러한 신호를 신중하게 접근하고 거래 결정을 내리기 전에 추가 요소로 검증해야 합니다. 도구의 다른 구성 요소에 대한 자세한 내용은 다음 섹션을 참조하십시오.
- 주문 및 브레이커 블록
주문 블록과 브레이커 블록은 가격 행동 분석에서 중요한 개념으로, 트레이더가 시장 구조 내 중요한 수준을 식별하는 데 도움을 줍니다.
주문 블록은 중요한 매수 또는 매도 활동이 발생한 특정 가격 구역입니다. 이 구역은 종종 대형 기관 투자자나 시장 조성자의 행동을 나타내며, 이들은 시장에 영향을 미치는 대규모 주문을 실행합니다.
브레이커 블록은 강한 반전이 발생하여 현재 시장 구조가 깨지는 특정 가격 구역입니다. 이 블록은 가격이 중요한 저항 또는 지지에 부딪혀 반전이 일어난 영역을 나타냅니다.
요약하면, 매수 측과 매도 측 유동성은 시장 수요와 공급 역학에 대한 중요한 통찰을 제공하여, 트레이더가 다양한 가격 수준에서 주문 가능성을 기반으로 정보에 입각한 결정을 내리는 데 도움을 줍니다.
- 매수 측 및 매도 측 유동성
매수 측과 매도 측 유동성 구역은 시장에서 잠재적 전환점을 식별하는 데 중요합니다. 이 구역은 중요한 매수 또는 매도 관심이 집중된 곳으로, 미래 가격 움직임에 영향을 미칩니다.
요약하면, 매수 측과 매도 측 유동성은 시장 수요와 공급 역학에 대한 중요한 통찰을 제공하여, 트레이더가 다양한 가격 수준에서 주문 가능성을 기반으로 정보에 입각한 결정을 내리는 데 도움을 줍니다.
- 유동성 공백
유동성 공백은 가격 차트에서 거래 활동이 부족한 갭 또는 영역입니다. 이 공백은 매수 또는 매도 주문이 거의 또는 전혀 없는 구역을 나타내며, 시장이 이 영역에 진입할 때 급격한 가격 변동을 초래하는 경우가 많습니다.
요약하면, 유동성 공백은 거래 활동이 부족한 가격 차트상의 중요한 영역으로, 급격한 가격 변동과 변동성 증가를 초래할 수 있어 트레이더가 분석 및 의사 결정 과정에서 반드시 고려해야 할 요소입니다.
- 스윙 포인트
반전 가격 지점은 일반적으로 스윙 포인트라고 불립니다. 트레이더는 종종 과거 스윙 포인트를 분석하여 시장 추세를 파악하고 잠재적 거래 진입 및 종료 지점을 찾습니다.
이 스크립트에서는 스윙 포인트가 백페인팅(back painting)의 영향을 받으므로, 감지된 위치와 실제 위치가 다를 수 있음을 유의하십시오.
스윙 포인트 감지 및 이 스크립트의 독특한 기능은 오직 가격 행동에만 의존하며, 숫자 기반 사용자 정의 설정이 필요 없습니다. 이 과정은 단기 스윙 포인트 감지로 시작합니다:
- 단기 스윙 고점(STH): 양쪽에 더 낮은 고점이 있는 가격 최고점으로 식별됩니다.
- 단기 스윙 저점(STL): 양쪽에 더 높은 저점이 있는 가격 최저점으로 인식됩니다.
중기 및 장기 스윙 포인트는 동일한 방법으로 감지하지만 약간의 변형이 있습니다. 가격 캔들을 직접 분석하는 대신 이전에 감지된 단기 스윙 포인트를 사용합니다. 중기 스윙 포인트는 단기 스윙 포인트를 분석하여, 장기 스윙 포인트는 중기 스윙 포인트를 사용합니다.
이 방법은 시장 역학을 강력하고 객관적으로 분석할 수 있게 하여, 트레이더에게 신뢰할 수 있는 시장 구조 통찰을 제공합니다. 감지된 스윙 포인트는 이 도구로 제공되는 시장 구조, 매수/매도 측 유동성 수준, 주문 및 브레이커 블록 식별의 기초가 됩니다.
요약하면, 스윙 포인트는 기술 분석에서 필수 요소로, 트레이더가 추세, 지지 및 저항 수준, 최적의 진입 및 종료 지점을 식별하는 데 도움을 줍니다. 스윙 포인트를 이해하면 시장의 자연스러운 가격 움직임에 기반한 정보에 입각한 결정을 내릴 수 있습니다.
설정
- 시장 구조
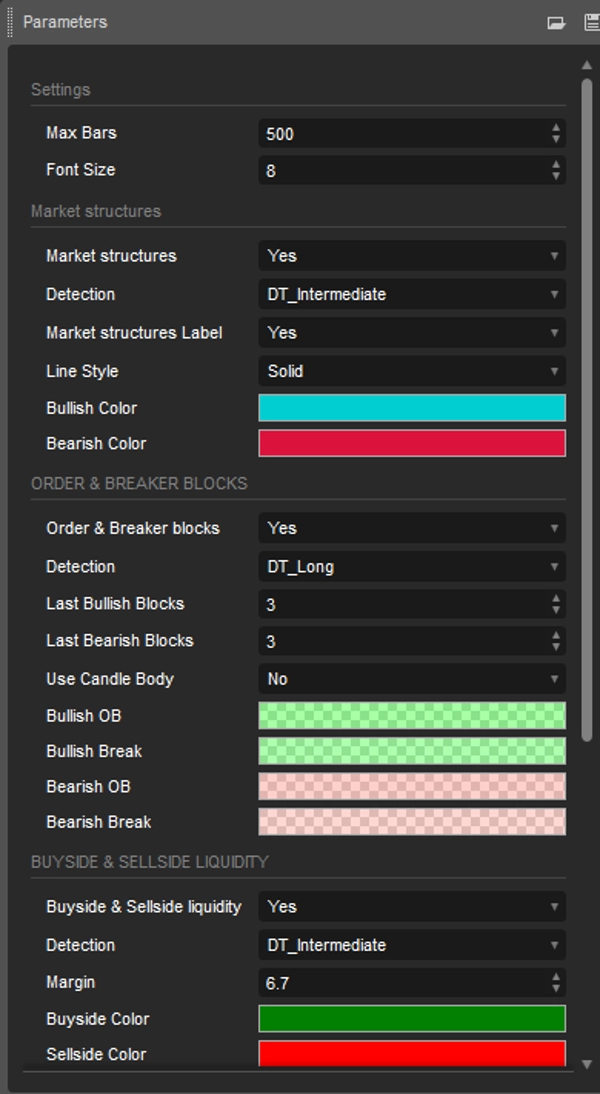
시장 구조: 시장 구조(전환 및 붕괴)의 표시 여부를 전환합니다.
감지: 단기, 중기, 장기 스윙 수준의 중요도를 기반으로 시장 구조를 감지할 수 있는 옵션입니다.
시장 구조 레이블: 시장 구조 유형을 강조하는 레이블의 표시 여부를 제어합니다.
선 스타일: 시장 구조를 나타내는 선의 스타일을 사용자 정의합니다.
- 주문 및 브레이커 블록
주문 및 브레이커 블록: 주문 및 브레이커 블록의 표시 여부를 전환합니다.
감지: 단기, 중기, 장기 스윙 수준의 중요도를 기반으로 주문 및 브레이커 블록을 감지할 수 있는 옵션입니다.
최근 강세 블록: 차트에 표시할 가장 최근의 강세 주문/브레이커 블록 수입니다.
최근 약세 블록: 차트에 표시할 가장 최근의 약세 주문/브레이커 블록 수입니다.
캔들 몸통 사용: 전체 캔들 범위 대신 주문 블록 영역으로 캔들 몸통을 사용할 수 있게 합니다.
- 매수 측 및 매도 측 유동성
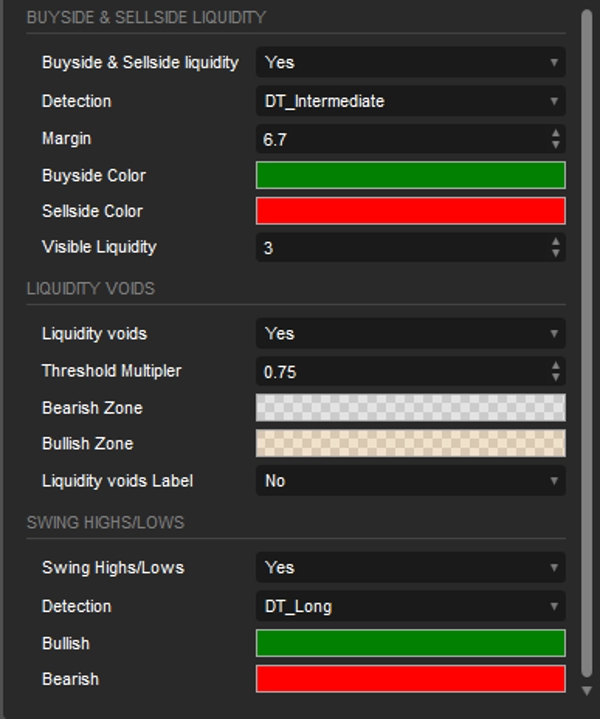
매수 측 및 매도 측 유동성: 매수 측 및 매도 측 유동성 수준의 표시 여부를 전환합니다.
감지: 단기, 중기, 장기 스윙 수준의 중요도를 기반으로 매수 측 및 매도 측 유동성을 감지할 수 있는 옵션입니다.
마진: 유동성 수준 감지에 대한 마진/민감도를 설정합니다.
표시 유동성: 시각화할 유동성 수준/구역의 양을 제어합니다.
- 유동성 공백
유동성 공백: 강세 및 약세 유동성 공백 표시를 활성화합니다.
임계값 배수: 200기간 ATR 범위에 하드코딩된 임계값의 배수를 정의합니다.
레이블: 유동성 공백을 나타내는 레이블 표시를 활성화합니다.
- 스윙 포인트
스윙 고점/저점: 스윙 수준의 표시 여부를 전환합니다.
감지: 단기, 중기, 장기 스윙 수준의 중요도를 기반으로 스윙 수준을 감지할 수 있는 옵션입니다.
요약
Key functionalities include:
- Market Structures: Detects Market Structure Shifts (potential trend reversals) and Breaks of Structure (trend continuations) based on price patterns.
- Order & Breaker Blocks: Highlights significant price zones where institutional buying/selling or strong reversals occur.
- Buy-side & Sell-side Liquidity: Identifies zones of concentrated buying or selling interest that may influence price movements.
- Liquidity Voids: Marks price chart gaps with minimal trading activity, often leading to sharp price moves.
- Swing Points: Detects short-, intermediate-, and long-term reversal points to aid in trend analysis and trade decision-making.
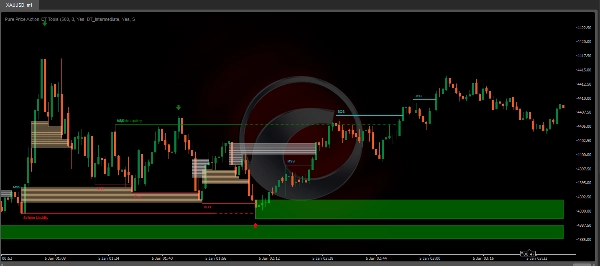
The tool offers customizable settings to toggle visibility and detection sensitivity for each feature, including options to adjust detection based on swing level significance and display preferences. It supports analysis across various markets such as Forex, Crypto (e.g., BTCUSD), and indices (e.g., NAS100, XAUUSD). The indicator provides an objective framework for analyzing market dynamics based solely on price action patterns.
고객 리뷰
5 | 67 % | |
4 | 0 % | |
3 | 33 % | |
2 | 0 % | |
1 | 0 % |


!["[Hamster-Coder] Moving Average MTF" 로고](https://cdn.ctrader.com/image/webp/b11b98b1-194d-4b8e-b00e-d611826ad159_31226)


