
Simple ICT Concepts
Wskaźnik
3 zakupy
Wersja 1.0, Dec 2025
Windows, Mac
4.0
Opinie: 1
Opis
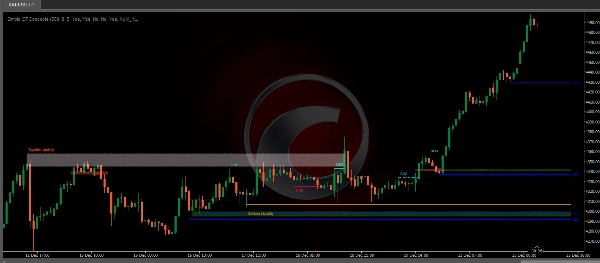
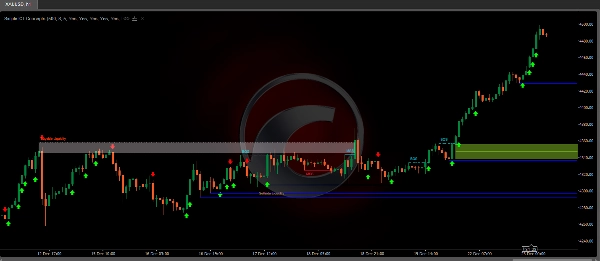
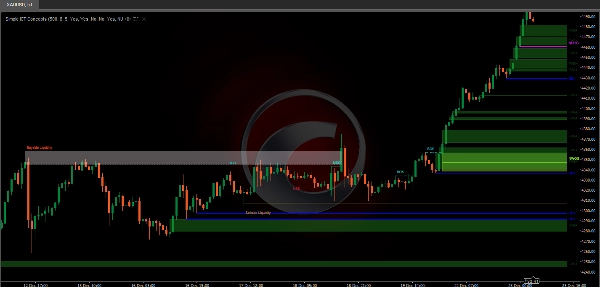
Wskaźnik Simple ICT Concepts jest potężnym narzędziem zaprojektowanym, aby pomóc traderom stosować zasady metodologii Inner Circle Trader (ICT). Ten wskaźnik koncentruje się na identyfikacji kluczowych stref, takich jak poziomy płynności, wsparcia i oporu oraz struktura rynku, co czyni go nieocenionym zasobem dla traderów korzystających z analizy price action i koncepcji smart money.
Kluczowe cechy
Struktura rynku:
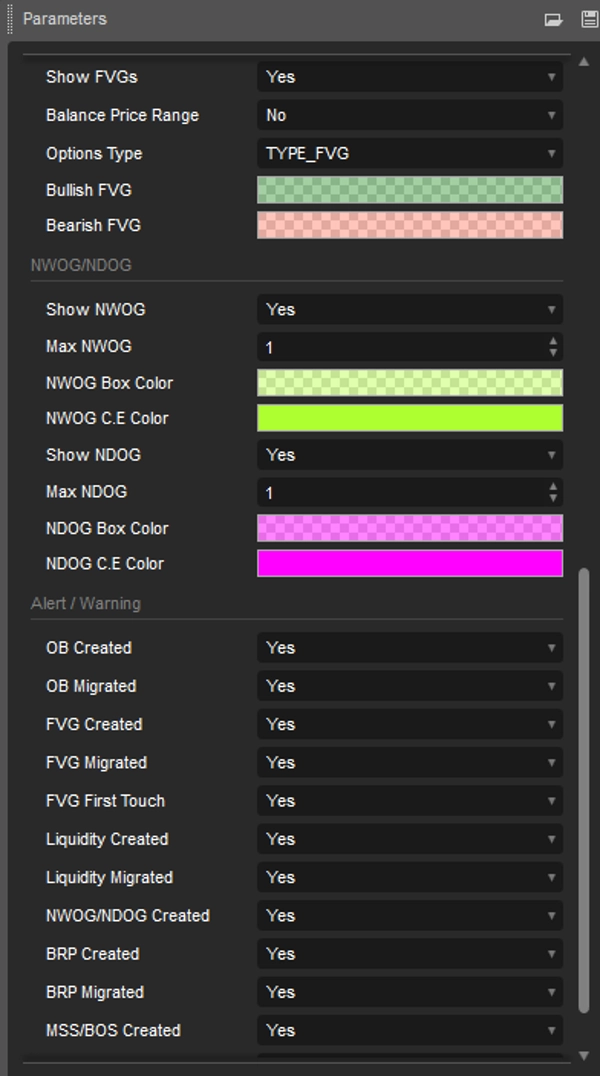
Etykiety struktury rynku są tworzone na podstawie przebicia przez cenę poprzedniego punktu zwrotnego. Pozwala to użytkownikowi określić aktualny trend rynkowy na podstawie price action.Wskaźnik zawiera dwa typy etykiet struktury rynku:Market Structure Shift (MSS)Break Of Structure (BOS)MSS występuje, gdy cena przebija swing low w trendzie wzrostowym lub swing high w trendzie spadkowym, wskazując na potencjalne odwrócenie.Często jest to oznaczane jako "CHoCH", ale ICT określa to jako MSS. Z kolei etykiety BOS pojawiają się, gdy cena przebija swing high w trendzie wzrostowym lub swing low w trendzie spadkowym.Występowanie tych konkretnych punktów zwrotnych jest spowodowane korektami (indukcjami), które podkreślają polowanie na płynność na niższych interwałach czasowych.Kluczowe punkty zwrotne: Higher Highs (HH) i Lower Lows (LL), Higher Lows (HL) i Lower Highs (LH)Przemieszczenie:Przemieszczenia to scenariusze, w których cena tworzy kolejne świece o tym samym nastawieniu (byczym/niedźwiedzim) z dużymi korpusami i krótkimi cieniami.Można je technicznie zidentyfikować poprzez pozytywną autokorelację (zmiana od zamknięcia do otwarcia jest bardziej prawdopodobna, że zostanie podążona przez zmianę tego samego znaku) oraz skupienie zmienności (duże zmiany są następowane przez duże zmiany).Przemieszczenia mogą być przyczyną powstawania nierówności oraz struktury rynku, które mogą być spowodowane pełnym wykonaniem meta zlecenia.Nierównowaga wolumenu:Nierównowaga wolumenu (V.I.) występuje, gdy istnieje obszar ceny pozbawiony korpusu świecy. Występują ruchy w górę i w dół w nakładających się knotach, jednak ponieważ większość wolumenu znajduje się w korpusie świecy, nazywamy to nierównowagą wolumenu.Bloki zleceń:Blok zleceń ICT (Inner Circle Trader) to obszar cenowy na wykresie, gdzie duzi inwestorzy instytucjonalni składają znaczące zlecenia kupna lub sprzedaży. Bloki zleceń są kluczową koncepcją w tradingu, ponieważ pomagają traderom identyfikować potencjalne poziomy wsparcia i oporu oraz przewidywać odwrócenia cen.Płynność:Poziomy płynności po stronie kupujących/sprzedających wskazują poziomy cen, na których uczestnicy rynku mogą składać zlecenia limit/stop.Poziomy płynności po stronie kupujących skupiają zlecenia stop-loss traderów krótkich pozycji oraz zlecenia limit traderów długich, natomiast poziomy płynności po stronie sprzedających skupiają zlecenia stop-loss traderów długich oraz zlecenia limit traderów krótkich.Te poziomy mogą pełnić różne role. Bardziej świadomi uczestnicy rynku mogą postrzegać te poziomy jako źródło płynności, a gdy płynność powyżej konkretnego poziomu zostanie zmniejszona, zostanie odnaleziona w innym obszarze.FVG/IFVG:Fair Value Gaps: Formacja trzech świec, gdzie cienie świec sąsiadujących z centralną świecą nie nakładają się, co podkreśla obszar luki.Implied Fair Value Gaps: W przeciwieństwie do fair value gap, implied fair value gap ma nakładające się cienie świec sąsiadujących z centralną świecą. Obszar luki jest konstruowany na podstawie średniej między odpowiednim cieniem a najbliższym ekstremum korpusu świecy.Zrównoważony zakres cenowy: Zrównoważone zakresy cenowe występują, gdy fair value gap nakłada się na poprzedni fair value gap, a obszar nakładania się tworzy obszar nierównowagi.NWOG/NDOG:Ten wskaźnik ujawnia nowe luki otwarcia tygodnia (NWOG) oraz nowe luki otwarcia dnia (NDOG). NWOG to luka między ceną zamknięcia piątku a ceną otwarcia niedzieli. NDOG to luka między ceną otwarcia a ceną zamknięcia poprzedniego dnia.
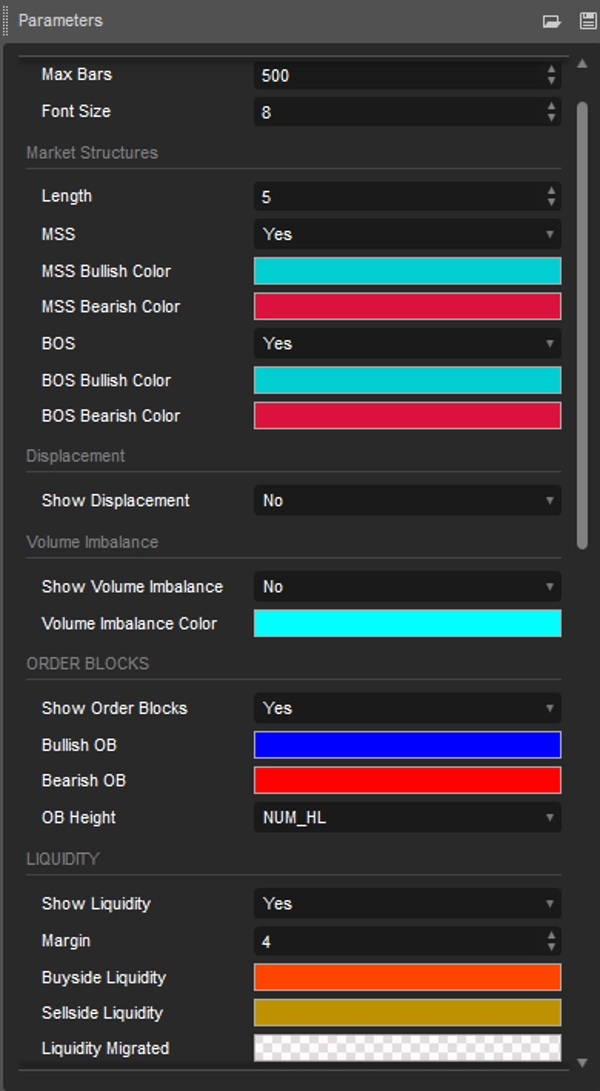
Funkcje konfigurowalne
Użytkownicy mogą dostosować ustawienia takie jak długość danych, kolory i style wyświetlania, aby dopasować je do swoich preferencji tradingowych.
Korzyści dla traderów
Oszczędza czas na ręcznej analizie, zwiększając efektywność handlu.
Pomaga podejmować szybkie i świadome decyzje podczas zmiennych warunków rynkowych.
Łatwy w użyciu zarówno dla początkujących, jak i doświadczonych traderów.
Podsumowanie
Wskaźnik Simple ICT Concepts to nie tylko narzędzie, ale kompleksowe rozwiązanie dla traderów chcących skutecznie wdrażać strategie ICT. To solidny wybór do ulepszania analizy rynku i precyzyjnego wykonywania transakcji.
Podsumowanie
Podsumowanie AI
The Simple ICT Concepts Indicator is a technical analysis tool designed to assist traders in applying the Inner Circle Trader (ICT) methodology. It identifies key market zones including liquidity levels, support and resistance, and market structure to support price action and smart money concept trading. The indicator labels market structure shifts (MSS) and breaks of structure (BOS) based on swing point breaks, helping users determine current market trends. It detects displacements characterized by successive candles with strong directional sentiment, volume imbalances where candle bodies leave gaps, and order blocks representing institutional buy or sell zones. The tool highlights buy-side and sell-side liquidity levels, indicating where stop-loss and limit orders cluster. It also identifies fair value gaps (FVG), implied fair value gaps (IFVG), balanced price ranges, and new week/day opening gaps (NWOG/NDOG). Users can customize settings such as data length, colors, and display styles to fit their trading preferences. The indicator aims to save time on manual analysis and facilitate quick, informed decisions in volatile markets. It is suitable for both beginners and experienced traders seeking to implement ICT strategies effectively across markets including Forex, cryptocurrencies, and indices like BTCUSD, XAUUSD, and NAS100.
Profil wskaźnika
Opinie klientów
4.0
Opinie: 1
5 | 0 % | |
4 | 100 % | |
3 | 0 % | |
2 | 0 % | |
1 | 0 % |
Opinie klientów
December 27, 2025
The signal still needs a chart check, no surprise there. One green trade proves nothing.
Dyskusja
Częste pytania
BTCUSD
Forex
Signal
Fair Value Gap
Crypto
XAUUSD
NAS100
Produkty dostępne za pośrednictwem cTrader Store, w tym boty handlowe, wskaźniki i wtyczki, dostarczane są przez deweloperów zewnętrznych i udostępniane wyłącznie w celach informacyjnych oraz w celu zapewnienia dostępu technicznego. cTrader Store nie jest brokerem i nie zapewnia doradztwa inwestycyjnego, nie udziela spersonalizowanych rekomendacji ani nie gwarantuje przyszłych wyników.


Cena
38
Sprzedaż
2.39K
Bezpłatne instalacje