
Opis
Ulepszony wskaźnik wsparcia i oporu
Odkryj moc analizy technicznej dzięki naszemu Ulepszonemu wskaźnikowi wsparcia i oporu dla cAlgo. To zaawansowane narzędzie zostało zaprojektowane, aby pomóc traderom identyfikować i wizualizować kluczowe poziomy wsparcia i oporu na ich wykresach handlowych, usprawniając podejmowanie decyzji i strategie handlowe.
Kluczowe funkcje:
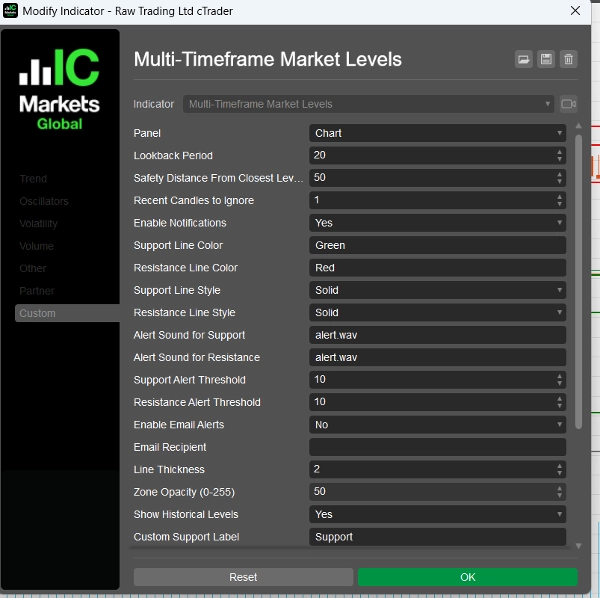
- Dostosowywane parametry: Dostosuj wskaźnik do swojego stylu handlu dzięki regulowanym ustawieniom, w tym okresom cofania, odległościom bezpieczeństwa, dźwiękom alertów i innym.
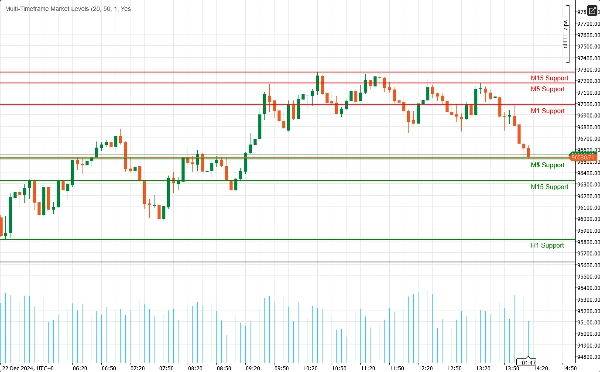
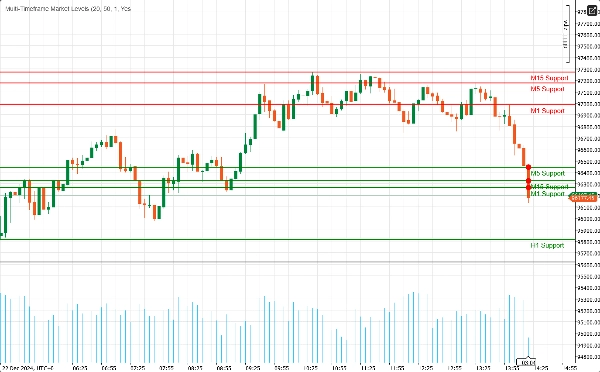
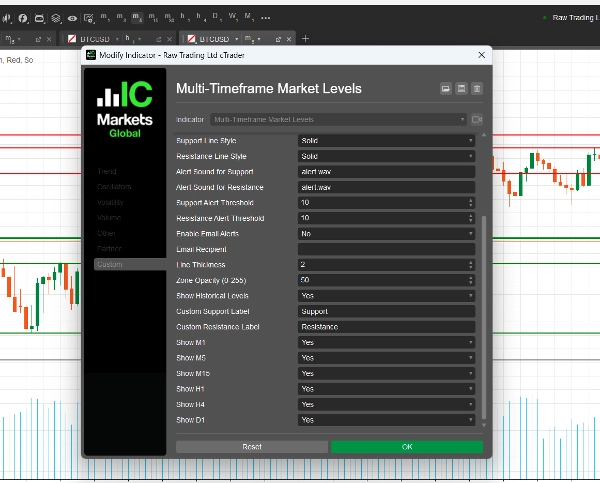
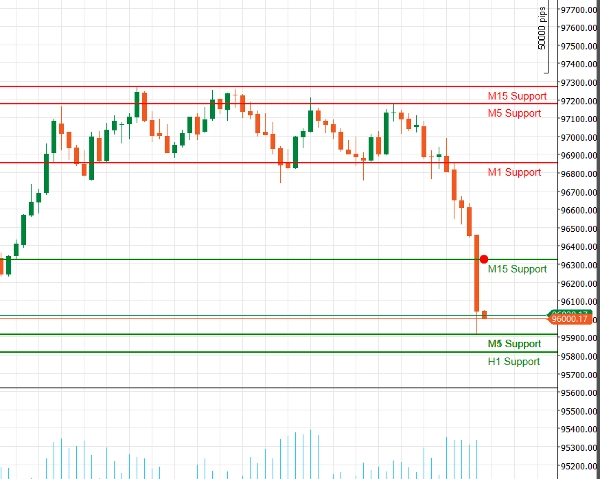
- Obsługa wielu interwałów czasowych: Analizuj jednocześnie wiele interwałów czasowych (M1, M5, M15, H1, H4, D1), aby uzyskać kompleksowy obraz dynamiki rynku i zidentyfikować kluczowe poziomy na różnych horyzontach handlowych.
- Alerty w czasie rzeczywistym: Bądź na bieżąco dzięki natychmiastowym powiadomieniom! Wskaźnik może wysyłać dźwiękowe alerty i powiadomienia e-mail, gdy cena zbliża się do krytycznych poziomów wsparcia lub oporu, zapewniając, że nigdy nie przegapisz okazji handlowej.
- Przejrzystość wizualna: Ciesz się wyraźnymi wizualizacjami poziomów wsparcia i oporu, z możliwością dostosowania kolorów i stylów linii. Wyróżnione strefy dostarczają dodatkowego kontekstu, ułatwiając dostrzeżenie potencjalnych punktów odwrócenia.
- Integracja z Fibonaccim: Wzbogac swoją analizę dzięki wbudowanemu rysowaniu poziomów Fibonacciego, co pozwala identyfikować potencjalne poziomy cofnięć i rozszerzeń w połączeniu z wsparciem i oporem.
- Przyjazny interfejs użytkownika: Zaprojektowany zarówno dla początkujących, jak i doświadczonych traderów, wskaźnik jest łatwy do skonfigurowania i bezproblemowo integruje się z Twoim istniejącym środowiskiem cAlgo.
Jak korzystać z Ulepszonego wskaźnika wsparcia i oporu
- Instalacja:
-
- Pobierz wskaźnik i zaimportuj go do swojej platformy cAlgo.
- Dołącz wskaźnik do wybranego wykresu.
- Konfiguracja parametrów:
-
- Dostosuj ustawienia do swojego stylu handlu. Ustaw okres cofania, odległość bezpieczeństwa oraz wybierz preferowane kolory i style linii dla poziomów wsparcia i oporu.
- Włącz powiadomienia, jeśli chcesz otrzymywać alerty, gdy cena zbliża się do tych poziomów.
- Wybór interwałów czasowych:
-
- Wybierz, które interwały czasowe chcesz wyświetlać. Możesz zdecydować się na pokazanie lub ukrycie poziomów z M1, M5, M15, H1, H4 i D1, w zależności od swojej strategii handlowej.
- Analiza wykresu:
-
- Obserwuj poziomy wsparcia i oporu narysowane na wykresie. Te poziomy wskazują miejsca, gdzie cena prawdopodobnie się odwróci lub skonsoliduje.
Jak handlować z Ulepszonym wskaźnikiem wsparcia i oporu
- Identyfikacja punktów wejścia:
-
- Transakcje długie: Szukaj okazji do kupna, gdy cena zbliża się do poziomu wsparcia, zwłaszcza jeśli pojawiają się oznaki odbicia (np. bycze formacje świecowe).
- Transakcje krótkie: Rozważ sprzedaż, gdy cena zbliża się do poziomu oporu, szczególnie jeśli pojawiają się sygnały niedźwiedzie (np. niedźwiedzie formacje świecowe).
- Korzystanie z alertów:
-
- Wykorzystaj alerty w czasie rzeczywistym, aby być powiadamianym, gdy cena zbliża się do kluczowych poziomów wsparcia lub oporu. Pozwala to działać szybko i wykorzystać potencjalne okazje handlowe.
- Łączenie z innymi wskaźnikami:
-
- Wzbogac swoją strategię, łącząc Ulepszony wskaźnik wsparcia i oporu z innymi wskaźnikami technicznymi (np. średnie kroczące, RSI, MACD), aby potwierdzić sygnały i poprawić dokładność swoich transakcji.
- Ustawianie poziomów Stop-Loss i Take-Profit:
-
- Ustaw zlecenia stop-loss tuż poniżej poziomów wsparcia dla transakcji długich oraz tuż powyżej poziomów oporu dla transakcji krótkich, aby zarządzać ryzykiem.
- Ustaw cele take-profit na następnym istotnym poziomie wsparcia lub oporu, aby zmaksymalizować potencjalne zyski.
Dlaczego warto wybrać Ulepszony wskaźnik wsparcia i oporu?
Poruszanie się po złożonościach rynków finansowych może być wyzwaniem. Ulepszony wskaźnik wsparcia i oporu wyposaża Cię w narzędzia niezbędne do identyfikacji kluczowych poziomów cenowych i podejmowania świadomych decyzji handlowych. Niezależnie od tego, czy jesteś day traderem, czy inwestorem długoterminowym, ten wskaźnik jest niezbędnym dodatkiem do Twojego zestawu narzędzi handlowych.
Podsumowanie
Opinie klientów
5 | 100 % | |
4 | 0 % | |
3 | 0 % | |
2 | 0 % | |
1 | 0 % |


