
AutoLines™ Support & Resistance
Wskaźnik
2 zakupy
Wersja 1.0, May 2025
Windows, Mac
4.5
Opinie: 4
Opis
FlexSR to Twój wszechstronny, profesjonalny wskaźnik wsparcia i oporu dla cTrader. Automatycznie identyfikuje lokalne maksima i minima w wybranym przez Ciebie okresie analizy, wyświetla do N najnowszych poziomów i rozciąga je na wykresie. Dzięki w pełni konfigurowalnym kolorom, stylom linii, grubości oraz opcjonalnym etykietom z datą i ceną, FlexSR zapewnia przejrzyste strefy, w których cena prawdopodobnie zatrzyma się, odwróci lub wybije — dzięki czemu możesz handlować z pewnością.
Kluczowe funkcje
Podsumowanie
Podsumowanie AI
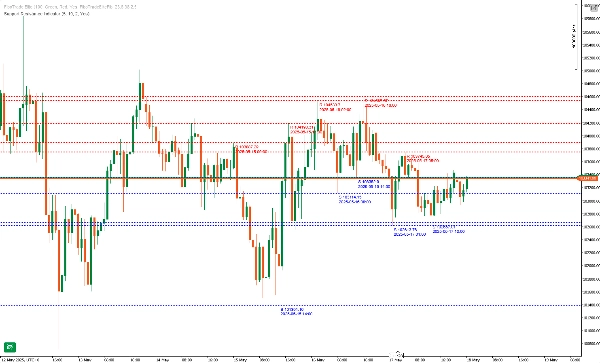
AutoLines™ Support & Resistance (FlexSR) is a professional indicator for cTrader that automatically detects pivot highs and lows over a user-defined lookback period. It plots up to N of the most recent support and resistance levels and extends these lines across the chart for continuous visibility. The indicator features customizable colors, line styles, thickness (1–5 px), and optional date-price labels for clear identification of key zones where price may stall, reverse, or break out.
Key functionalities include:
- Automatic pivot detection scanning each bar for true swing highs and lows.
- Dynamic management of displayed levels, showing only the user-set maximum number of lines to maintain chart clarity.
- Non-interactive, lockable lines that redraw automatically to prevent accidental changes.
- Real-time updates on every tick, ensuring levels remain current even in fast markets.
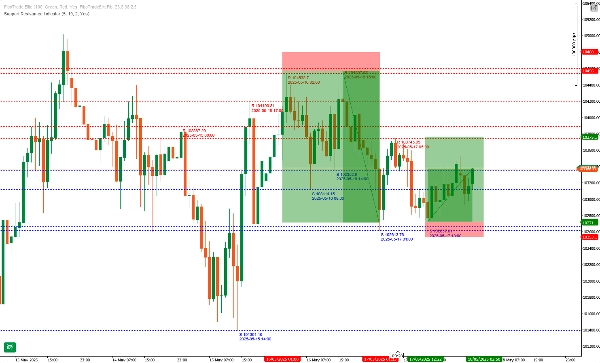
FlexSR supports intuitive trade management by visually highlighting confluence zones and providing clear support and resistance references. It is designed for ease of use with sensible default settings and minimal configuration. The indicator aids traders in identifying potential reversal and breakout points, supporting various trading strategies with precise and reliable level plotting.
Key functionalities include:
- Automatic pivot detection scanning each bar for true swing highs and lows.
- Dynamic management of displayed levels, showing only the user-set maximum number of lines to maintain chart clarity.
- Non-interactive, lockable lines that redraw automatically to prevent accidental changes.
- Real-time updates on every tick, ensuring levels remain current even in fast markets.
FlexSR supports intuitive trade management by visually highlighting confluence zones and providing clear support and resistance references. It is designed for ease of use with sensible default settings and minimal configuration. The indicator aids traders in identifying potential reversal and breakout points, supporting various trading strategies with precise and reliable level plotting.
Profil wskaźnika
Opinie klientów
4.5
Opinie: 4
5 | 50 % | |
4 | 50 % | |
3 | 0 % | |
2 | 0 % | |
1 | 0 % |
Opinie klientów
November 9, 2025
AutoLines™ S&R does the heavy lifting - clear, dynamic levels that adapt to price action. Perfect for traders who love clean charts and structure. Missing alerts, but performance and accuracy make it a must-have for support/resistance setups.
May 30, 2025
May 28, 2025
May 24, 2025
messy signals are easier to question, but overconfidence is the real danger.
Dyskusja
Częste pytania
Breakout
Produkty dostępne za pośrednictwem cTrader Store, w tym boty handlowe, wskaźniki i wtyczki, dostarczane są przez deweloperów zewnętrznych i udostępniane wyłącznie w celach informacyjnych oraz w celu zapewnienia dostępu technicznego. cTrader Store nie jest brokerem i nie zapewnia doradztwa inwestycyjnego, nie udziela spersonalizowanych rekomendacji ani nie gwarantuje przyszłych wyników.


![Logo „Gaussian Channel [Iridio Capital]”](https://cdn.ctrader.com/image/webp/7c039209-5573-4a54-a072-f9528b503103_41960)


Cena
Od 22/11/2024
133
Sprzedaż
2.58K
Bezpłatne instalacje