
ZigzagSR – Dynamiczne huśtawki Zigzag z automatycznym wsparciem i oporem
Odkryj wyraźniejszą strukturę rynku i precyzyjne strefy wejścia dzięki ZigzagSR, potężnemu wskaźnikowi cTrader, który:
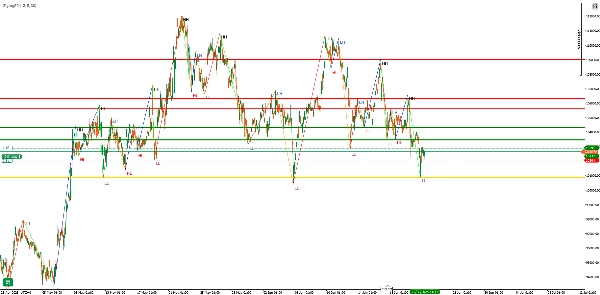
- Rysuje w czasie rzeczywistym nieprzemalowujące się huśtawki zigzag (wyższe szczyty, niższe szczyty, wyższe dołki, niższe dołki)
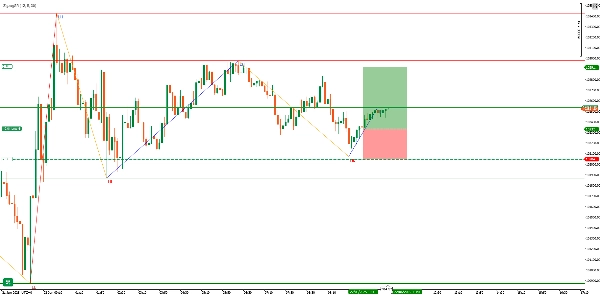
- Automatycznie rysuje dynamiczne poziomy wsparcia i oporu oparte na najnowszych punktach zwrotnych
- Oznacza każdy punkt huśtawki („HH”, „LH”, „HL”, „LL”) dla szybkiego zrozumienia trendu
Kluczowe funkcje
- Adaptacyjne wykrywanie Zigzag
-
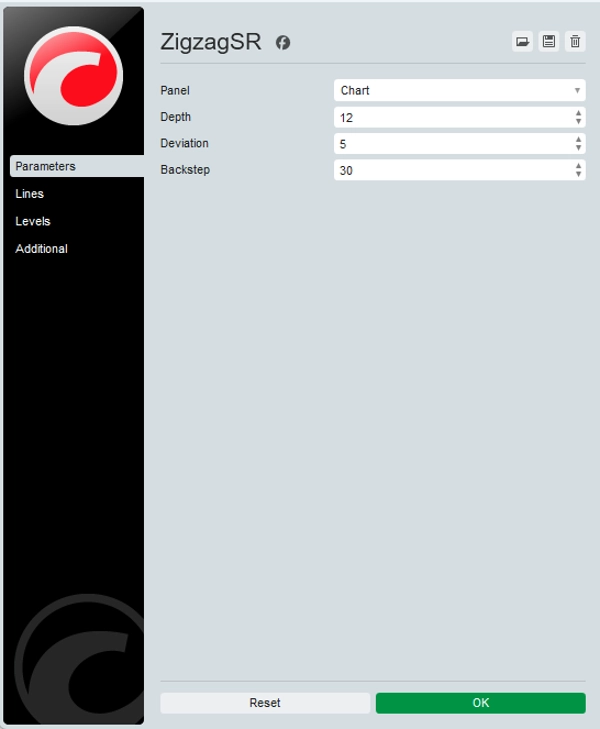
- Konfigurowalne Depth, Deviation i Backstep parametry do precyzyjnego dostosowania czułości na szumy rynkowe
- Logika nieprzemalowująca zapewnia, że historyczne sygnały pozostają stabilne po ich narysowaniu
- Automatyczne poziomy SR
-
- Rysuje linię Pivot na ostatnim ważnym punkcie huśtawki (złota linia)
- Podświetla do trzech ostatnich szczytów Resistance (czerwone linie) oraz trzy dołki Support (zielone linie) przed pivotem
- Linie aktualizują się płynnie wraz z powstawaniem nowych huśtawek, utrzymując wykres w porządku
- Wyraźne etykiety wizualne
-
- „HH” (Higher High) i „LH” (Lower High) dla niedźwiedzich/wyższych szczytów
- „HL” (Higher Low) i „LL” (Lower Low) dla byczych/niższych dołków
- Kolorowe segmenty zigzag:
-
- HH → Lime
- LH → Orange
- HL → Blue
- LL → Red
Wejścia i dostosowanie
ParametrDomyślnyOpis
Depth
12
Liczba słupków do analizy lokalnych szczytów/dołków
Deviation
5
Minimalny ruch ceny (w tickach) uznawany za huśtawkę
Backstep
3
Liczba słupków do „przewinięcia” w celu eliminacji fałszywych punktów zwrotnych
Wskazówka: Zwiększ Depth i Deviation na wyższych interwałach, aby filtrować szumy; zmniejsz je na M1/M5 dla większej czułości.
Dlaczego warto używać ZigzagSR?
- Potwierdzenie trendu: Wyraźnie rozróżnia huśtawki impulsowe od korekcyjnych — idealne dla traderów swingowych i breakout.
- Strefy wejścia SR: Automatycznie oznaczone poziomy pomagają precyzyjnie określić strefy wejścia, stop-loss i take-profit bez ręcznego rysowania linii.
- Tworzenie strategii: Etykiety i linie są bezpośrednio wykorzystywane w EA/cBots lub systemach manualnych — buduj spójne, oparte na regułach ustawienia.
Jak to działa
- Mapowanie szczytów/dołków
-
- Skanuje słupki z ostatnich
Depthokresów, aby oznaczyć lokalne ekstremy (_highMapi_lowMap).
- Skanuje słupki z ostatnich
- Budowa huśtawki
-
- Przełącza się między stanami byczymi i niedźwiedzimi, dodając tylko istotne punkty zwrotne do listy huśtawek.
- Przypisywanie etykiet
-
- Porównuje każdy punkt zwrotny z poprzednim, aby oznaczyć go jako HH/LH lub HL/LL.
- Rysowanie SR
-
- Identyfikuje najnowszy pivot jako „linię pivot”, a następnie rysuje poprzednie trzy ważne szczyty i dołki jako opór/wsparcie.
- Renderowanie Zigzag
-
- Łączy wszystkie punkty huśtawki kolorowymi liniami trendu i nakłada etykiety tekstowe lekko przesunięte dla czytelności.
Zastosowania i wskazówki
- Swing Trading: Jedź na impulsach wielosłupkowych — wchodź przy cofnięciach do linii pivot, celuj w następny poziom SR.
- Potwierdzenie wybicia: Czekaj, aż cena przebije linię oporu narysowaną przez ZigzagSR, a następnie potwierdź wolumenem lub RSI.
- Nakładanie z innymi wskaźnikami: Łącz z średnimi kroczącymi, dywergencjami RSI lub profilami wolumenu, aby wzmocnić sygnały.
Rozpocznij w kilka sekund:
- Zainstaluj ZigzagSR ze sklepu cTrader.
- Upuść go na dowolny wykres — nie są wymagane zewnętrzne biblioteki.
- Dostosuj trzy parametry wejściowe do preferowanego interwału i stylu strategii.
Podnieś analizę wykresu dzięki strukturze huśtawek w czasie rzeczywistym oraz dynamicznemu wsparciu i oporowi — wypróbuj ZigzagSR już dziś!
5 | 33 % | |
4 | 67 % | |
3 | 0 % | |
2 | 0 % | |
1 | 0 % |


