
GUPPY-MASTER V3
지표
251 다운로드
버전 1.0, Mar 2026
Windows, Mac
5.0
리뷰: 3
설명
GUPPY TREND MASTER V3 (4X4 TRADING TECHNOLOGY )
38-EMA 무지개로 시장 심리 시각화
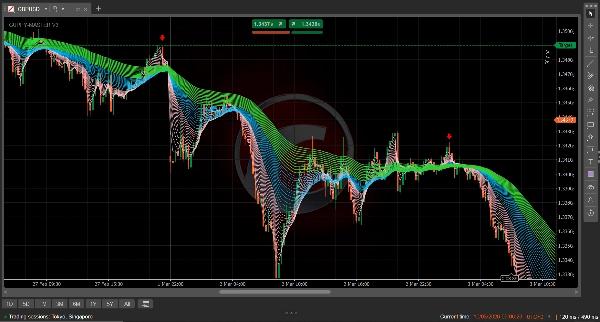
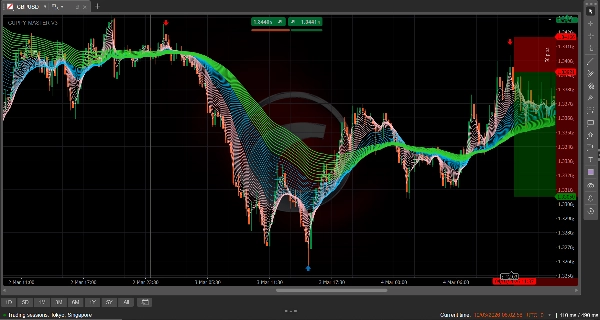
The Guppy Trend Master 4X4 는 복잡한 가격 움직임을 명확하고 색상으로 구분된 시장 심리 지도으로 변환하는 cTrader용 프리미엄 기술 분석 도구입니다. 38개의 지수 이동평균선(EMA)을 동시에 표시하여 트레이더가 일시적인 "노이즈"와 진정한 추세 반전을 구분할 수 있게 합니다.
4X4 시각적 논리
이 지표는 시장 데이터를 세 가지 뚜렷한 "리본"으로 구성하여 추세에 대한 다차원적 관점을 제공합니다:
- 핑크 리본 (기간 2–15): "투기꾼" 그룹입니다. 이 선들은 단기 트레이더를 나타냅니다. 선들이 펼쳐지면 모멘텀이 강합니다. 선들이 압축되면 움직임이 지쳐가는 상태입니다.
- 블루 리본 (기간 17–41): "다리" 그룹입니다. 중요한 전환 구역 역할을 하며 강한 추세 중 재진입을 위한 "반등" 구간으로 자주 작용합니다.
- 그린 리본 (기간 44–74): "투자자" 그룹입니다. 장기 심리를 나타내며, 넓고 펼쳐진 녹색 리본은 강력하고 안정적인 추세를 의미하며 깨기 어렵습니다.
왜 이 지표를 사용해야 하나요?
- 즉각적인 추세 확인: 리본이 엉켜 있으면 시장이 횡보 중임을 한눈에 알 수 있습니다. 리본이 펼쳐져 분리되어 있으면 추세가 강합니다.
- 정밀 스캘핑 구역: M1 및 M5 타임프레임에 최적화되어 4X4는 "저점 매수" 및 "고점 매도" 구역을 정확하게 강조합니다.
- 변동성 시각화: 리본 사이의 "갭"은 움직임 뒤에 있는 확신의 정도를 알려줍니다. 4X4 논리에서 보이는 "명확한 갭"은 높은 확률의 거래 환경을 나타냅니다.
- 지연 없는 논리: 지수 이동평균선(EMA)을 사용하여 4X4는 표준 SMA 기반 Guppy 지표보다 가격 변화에 더 빠르게 반응하여 현대의 고빈도 시장에 적합합니다.
신호 읽는 방법
- 강세 강도: 핑크가 위에 있고, 그 다음 블루, 맨 아래에 그린이 있습니다. 모든 그룹이 위쪽으로 펼쳐져 선들 사이에 눈에 띄는 간격이 있습니다.
- 약세 강도: 그린이 위에 있고, 그 다음 블루, 맨 아래에 핑크가 있습니다. 모든 그룹이 아래쪽으로 펼쳐져 있습니다.
- 압축: 세 그룹이 모두 한 점으로 수렴할 때, 대규모 돌파가 임박한 상태입니다.
요약
AI 요약
The GUPPY TREND MASTER V3 is a technical analysis indicator designed for the cTrader platform that visualizes market sentiment using 38 Exponential Moving Averages (EMAs). It organizes these EMAs into three color-coded ribbons to provide a multi-dimensional view of market trends: the Pink Ribbon (periods 2–15) reflects short-term speculator activity, the Blue Ribbon (periods 17–41) serves as a transitional bridge zone, and the Green Ribbon (periods 44–74) indicates long-term investor sentiment. This structure helps traders distinguish between market noise and genuine trend reversals.
Key features include instant trend confirmation by observing ribbon separation or entanglement, precision scalping zones optimized for 1- and 5-minute timeframes, and visualization of market volatility through the spacing between ribbons. The use of EMAs ensures faster reaction to price changes compared to traditional SMA-based Guppy indicators, supporting high-frequency trading environments.
Signal interpretation is based on ribbon positioning and spacing: bullish trends show Pink above Blue above Green with upward fanning, bearish trends show the reverse with downward fanning, and convergence of all ribbons signals an imminent breakout. The indicator supports various markets including forex pairs (GBPUSD, USDJPY), cryptocurrencies, stocks, and commodities like gold (XAUUSD).
지표 프로필
고객 리뷰
5.0
리뷰: 3
5 | 100 % | |
4 | 0 % | |
3 | 0 % | |
2 | 0 % | |
1 | 0 % |
고객 리뷰
March 29, 2026
This is a nice indicator 😀. Overall the images are what is represented on the chart no faking. But only the arrows missing. Let me hope version 2 has them.
March 17, 2026
Very good 👍👍 indicator. Have looked for it every where finally I found it works every well
상담
자주 묻는 질문(FAQ)
Signal
Breakout
Scalping
GBPUSD
Crypto
Stocks
XAUUSD
NAS100
USDJPY
트레이딩 봇, 지표, 플러그인 등 cTrader Store에서 제공되는 상품은 제3자 개발자에 의해 제공되며, 이는 단순히 정보 및 기술적 접근을 목적으로 제공된 것입니다. cTrader Store는 중개인이 아니며, 투자 조언, 개인별 추천 또는 향후 성과에 대한 어떠한 보장도 제공하지 않습니다.
이 작성자의 상품 더 보기


!["High-Low Divergence [Iridio Capital]" 로고](https://cdn.ctrader.com/image/webp/443c4661-7abb-40f1-842f-4b6ec560649b_40914)


가격
가입일 27/02/2026
33.16K
거래량
25.96K
핍 수익
8
판매
391
무료 설치