
Penerangan
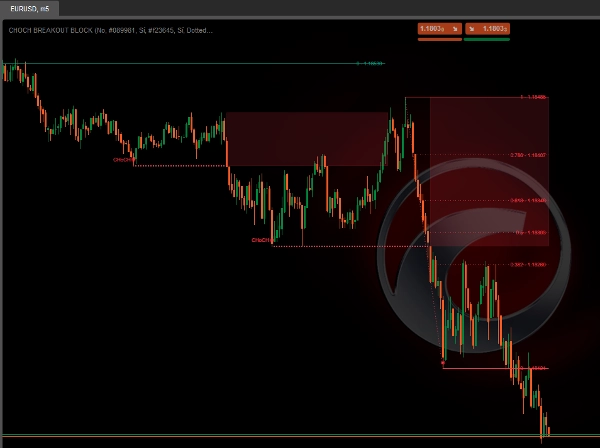
Blok Pecah CHoCH
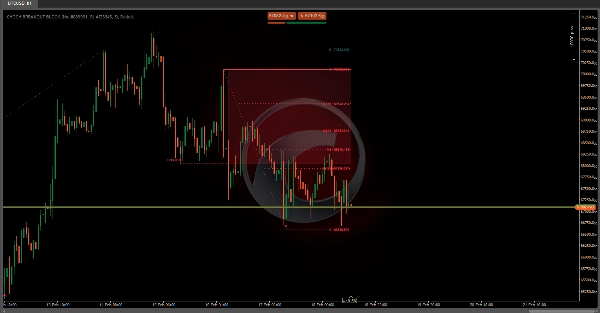
https://chartshots.spotware.com/c/69960085a796e
Penunjuk ini direka untuk pedagang yang beroperasi dengan Tindakan Harga dan Konsep Wang Pintar (SMC) metodologi. Penggunaan yang disyorkan:
- 🔍 Kenal pasti CHoCH sebagai isyarat pertama kemungkinan pembalikan struktur.
- 👀 Perhatikan zon minat yang dijana: ia adalah kawasan di mana harga biasanya kembali sebelum meneruskan arah baru.
- ⏳ Tunggu harga kembali ke zon dan, di dalamnya, cari kesesuaian dengan tahap Fibonacci (terutamanya 0.382, 0.5, 0.618 dan 0.786).
- ✅ Sahkan dengan lilin menelan (jika dalam mod Berasaskan Struktur) di dalam zon untuk kemasukan yang lebih tepat.
- ❌ Perdagangan adalah tidak sah jika harga melanggar sempadan bertentangan zon, kerana penunjuk itu sendiri membatalkan zon pada masa itu.
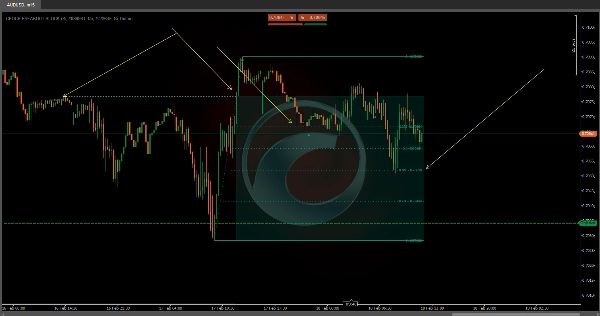
https://chartshots.spotware.com/c/699600271b05d
📊 1. Analisis Struktur Tiga Lapisan
Penunjuk menganalisis pasaran merentasi tiga tahap hierarki bersarang, dari yang paling kurang hingga paling penting:
- 🔹 Jangka Pendek: Mengesan paras tinggi dan rendah tempatan terkini dengan membandingkan tiga lilin berturut-turut. Paras rendah tempatan disahkan apabila lilin tengah lebih rendah daripada kedua-dua lilin sebelumnya dan seterusnya. Paras tinggi tempatan berfungsi sebaliknya.
- 🔸 Jangka Sederhana: Dibina di atas titik jangka pendek. Apabila ayunan jangka pendek membentuk corak rendah lebih rendah atau tinggi lebih tinggi (bermaksud tiga ayunan berturut-turut mengesahkan arah), satu titik jangka sederhana ditetapkan.
- 🔺 Jangka Panjang: Dibina dengan cara yang sama tetapi menggunakan titik jangka sederhana sebagai asasnya. Ini adalah lapisan yang paling penting dan yang mencetuskan acara utama penunjuk.
💡 Struktur berlapis ini memastikan bahawa hanya pergerakan dengan berat struktur sebenar menghasilkan isyarat, menapis bunyi jangka pendek.
🔄 2. CHoCH — Perubahan Watak
CHoCH adalah acara utama penunjuk. Ia berlaku apabila:
- 🟢 CHoCH Bullish: Harga ditutup di atas paras tinggi struktur jangka panjang sebelumnya, sementara arah pasaran sebelumnya adalah bearish. Ini menunjukkan bahawa penjual telah kehilangan kawalan dan pasaran boleh berbalik ke atas.
- 🔴 CHoCH Bearish: Harga ditutup di bawah paras rendah struktur jangka panjang sebelumnya, sementara arah sebelumnya adalah bullish. Ini menunjukkan bahawa pembeli telah kehilangan kawalan dan pasaran boleh berbalik ke bawah.
Apabila CHoCH dikesan, penunjuk melukis:
- ➡️ Satu garis mendatar pada tahap pecahan tepat (dengan gaya dan ketebalan yang dikonfigurasikan)
- 🏷️ Label "CHoCH" di atas garis itu
- 🟥🟩 Satu zon minat separa telus
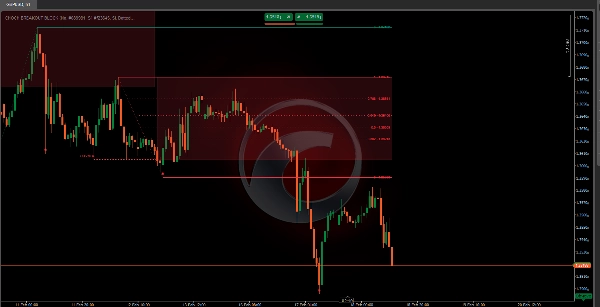
🗺️ 3. Zon Minat
Sebaik sahaja CHoCH berlaku, penunjuk secara automatik menentukan zon harga utama:
- 🟢 Dalam CHoCH Bullish: Zon merangkumi dari tahap pecahan (CHoCH) ke titik terendah yang ditemui antara ayunan struktur dan masa pecahan. Zon ini mewakili kawasan di mana harga boleh kembali untuk mencari kecairan sebelum meneruskan ke atas.
- 🔴 Dalam CHoCH Bearish: Zon merangkumi dari titik tertinggi yang ditemui antara ayunan dan pecahan ke tahap CHoCH. Ia mewakili kawasan di mana harga boleh kembali untuk mencari kecairan sebelum meneruskan ke bawah.
Zon meluas secara automatik bar demi bar selagi harga menghormati sempadannya. Pada masa harga melanggar sempadan bertentangan, zon berhenti meluas — menandakan ia telah diuji atau tidak sah.
👁️ Seperti yang dilihat dalam imej carta, zon merah separa telus mewakili kawasan minat bearish selepas acara CHoCH yang dikesan.
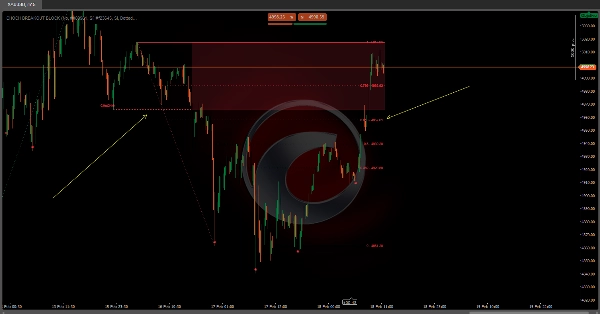
📐 4. Tahap Fibonacci Automatik
Selepas CHoCH dikesan, penunjuk TIDAK melukis Fibonacci dengan serta-merta. Fibonacci muncul pada peringkat kedua, apabila pasaran mengesahkan bahawa arah baru mempunyai berat struktur sebenar. Ini berlaku dalam dua langkah:
Langkah 1 — CHoCH berlaku: 🏷️ Garis pecahan, label, dan zon minat dilukis. Fibonacci belum kelihatan.
Langkah 2 — Pasaran membentuk ayunan jangka panjang baru dalam arah CHoCH: 📐 Hanya pada masa itu penunjuk secara automatik memproyeksikan tahap Fibonacci antara titik rujukan pecahan dan ayunan yang baru disahkan itu.
📌 Contoh: Dalam CHoCH bullish, Fibonacci akan dilukis dari titik terendah yang ditemui semasa pecahan hingga paras tinggi jangka panjang pertama yang dibentuk pasaran selepas itu. Jika harga meningkat tetapi belum mengukuhkan ayunan struktur itu, tahap Fibonacci belum akan kelihatan — ini adalah sengaja dan bukan bug.
Setelah aktif, tahap meluas bar demi bar selagi struktur kekal sah, dan dikira semula secara automatik jika pecahan struktur baru muncul. Tahap yang tersedia adalah:
Tahap
Maksud Biasa
0
Asal pergerakan
Penarikan balik kecil
⭐ Penarikan balik relevan pertama
0.5
⭐ Tahap tengah
⭐ Nisbah Emas
Varian Nisbah Emas
⭐ Penarikan balik mendalam
1
Sambungan 100%
🕯️ 5. Pengesanan Lilin Menelan
Penunjuk termasuk pengesanan corak lilin menelan sebagai isyarat kesesuaian tambahan:
- ▲ Satu lilin menelan bullish muncul apabila lilin hijau besar menelan sepenuhnya lilin merah kecil sebelumnya.
- ▼ Satu lilin menelan bearish muncul apabila lilin merah besar menelan sepenuhnya lilin hijau kecil sebelumnya.
Terdapat dua mod paparan:
- 📋 Semua: Menunjukkan setiap corak menelan yang muncul pada carta.
- 🎯 Berasaskan Struktur: Hanya menunjukkan corak menelan yang berlaku di dalam zon minat aktif, secara signifikan meningkatkan kepentingan isyarat.
Ringkasan
When a CHoCH occurs, the indicator marks the breakout level with a horizontal line and label, and automatically creates a semi-transparent interest zone where price is likely to return before continuing in the new direction. This zone extends dynamically as long as price respects its boundaries and is invalidated if price breaks the opposite boundary.
The indicator also projects Fibonacci retracement levels automatically after the market confirms the new trend direction by forming a new long-term swing. Supported Fibonacci levels include 0.236, 0.382, 0.5, 0.618, 0.65, 0.786, and 1. Additionally, it detects bullish and bearish engulfing candle patterns as confluence signals, with options to display all patterns or only those occurring within active interest zones for higher precision.
This tool supports multiple markets including BTCUSD, EURUSD, GBPUSD, NZDUSD, XAUUSD, NAS100, and USDJPY.
Ulasan pelanggan
5 | 100 % | |
4 | 0 % | |
3 | 0 % | |
2 | 0 % | |
1 | 0 % |


![Logo "[Hamster-Coder] Moving Average MTF"](https://cdn.ctrader.com/image/webp/b11b98b1-194d-4b8e-b00e-d611826ad159_31226)
