
GUPPY-MASTER V3
Indicatore
247 download
Versione 1.0, Mar 2026
Windows, Mac
5.0
Recensioni: 3
Da 27/02/2026
33.16K
Volume negoziato
25.96K
Profitto in pip
8
Vendite
386
Installazioni gratuite
Descrizione
GUPPY TREND MASTER V3 (4X4 TRADING TECHNOLOGY )
Visualizza il Sentimento del Mercato con l'Arcobaleno 38-EMA
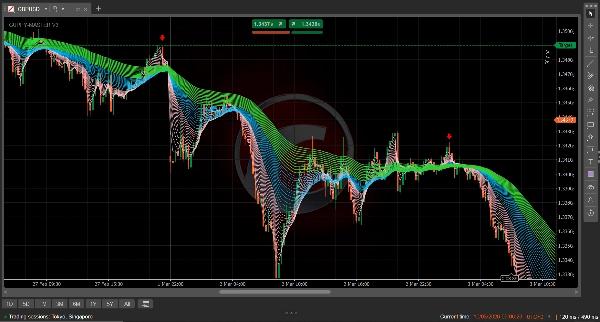
Il Guppy Trend Master 4X4 è uno strumento di analisi tecnica premium per cTrader che trasforma l'azione del prezzo complessa in una mappa chiara e codificata a colori della psicologia del mercato. Tracciando simultaneamente 38 Medie Mobili Esponenziali (EMA), consente ai trader di distinguere tra "rumore" temporaneo e vere inversioni di tendenza.
La Logica Visiva 4X4
L'indicatore organizza i dati di mercato in tre distinti "nastri" per offrirti una visione multidimensionale della tendenza:
- Il Nastro Rosa (Periodi 2–15): Il gruppo "Speculatori". Queste linee rappresentano i trader a breve termine. Quando si allargano, il momentum è alto. Quando si comprimono, il movimento si sta esaurendo.
- Il Nastro Blu (Periodi 17–41): Il gruppo "Ponte". Questo funge da zona di transizione critica. Spesso serve come area di "rimbalzo" per il rientro durante una forte tendenza.
- Il Nastro Verde (Periodi 44–74): Il gruppo "Investitori". Rappresenta il sentimento a lungo termine. Un nastro verde ampio e allargato indica una tendenza potente e stabile difficile da rompere.
Perché Usare l'Indicatore?
- Conferma Immediata della Tendenza: Vedi a colpo d'occhio se il mercato è in tendenza o laterale. Se i nastri sono intrecciati, resta fuori. Se sono allargati e separati, la tendenza è forte.
- Zone di Scalping di Precisione: Ottimizzato specificamente per i timeframe M1 e M5, il 4X4 evidenzia con precisione chirurgica le zone "Compra al Ribasso" e "Vendi al Rialzo".
- Visualizzazione della Volatilità: Il "gap" tra i nastri indica quanta convinzione c'è dietro un movimento. "Gap chiari" (come visto nella logica 4X4) indicano un ambiente di trading ad alta probabilità.
- Logica Senza Ritardo: Utilizzando Medie Mobili Esponenziali (EMA), il 4X4 reagisce ai cambiamenti di prezzo più rapidamente rispetto agli indicatori Guppy basati su SMA standard, rendendolo superiore per i mercati moderni ad alta frequenza.
Come Leggere il Segnale
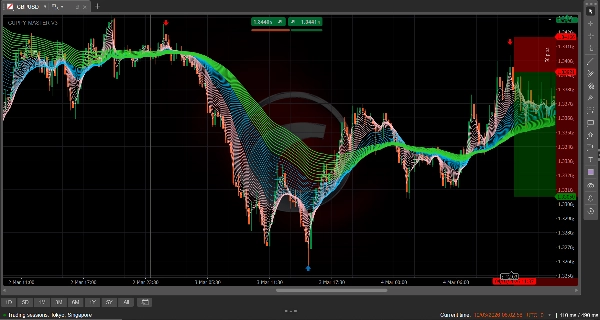
- Forza Rialzista: Il rosa è in cima, seguito dal blu, con il verde in basso. Tutti i gruppi si allargano verso l'alto con spazio visibile tra le linee.
- Forza Ribassista: Il verde è in cima, seguito dal blu, con il rosa in basso. Tutti i gruppi si allargano verso il basso.
- La Compressione: Quando tutti e tre i gruppi convergono in un unico punto, un breakout massiccio è imminente.
Riepilogo
Riepilogo AI
The GUPPY TREND MASTER V3 is a technical analysis indicator designed for the cTrader platform that visualizes market sentiment using 38 Exponential Moving Averages (EMAs). It organizes these EMAs into three color-coded ribbons to provide a multi-dimensional view of market trends: the Pink Ribbon (periods 2–15) reflects short-term speculator activity, the Blue Ribbon (periods 17–41) serves as a transitional bridge zone, and the Green Ribbon (periods 44–74) indicates long-term investor sentiment. This structure helps traders distinguish between market noise and genuine trend reversals.
Key features include instant trend confirmation by observing ribbon separation or entanglement, precision scalping zones optimized for 1- and 5-minute timeframes, and visualization of market volatility through the spacing between ribbons. The use of EMAs ensures faster reaction to price changes compared to traditional SMA-based Guppy indicators, supporting high-frequency trading environments.
Signal interpretation is based on ribbon positioning and spacing: bullish trends show Pink above Blue above Green with upward fanning, bearish trends show the reverse with downward fanning, and convergence of all ribbons signals an imminent breakout. The indicator supports various markets including forex pairs (GBPUSD, USDJPY), cryptocurrencies, stocks, and commodities like gold (XAUUSD).
Profilo indicatore
Recensioni dei clienti
5.0
Recensioni: 3
5 | 100 % | |
4 | 0 % | |
3 | 0 % | |
2 | 0 % | |
1 | 0 % |
Recensioni dei clienti
March 29, 2026
This is a nice indicator 😀. Overall the images are what is represented on the chart no faking. But only the arrows missing. Let me hope version 2 has them.
March 17, 2026
Very good 👍👍 indicator. Have looked for it every where finally I found it works every well
Discussioni
Domande frequenti
Signal
Breakout
Scalping
GBPUSD
Crypto
Stocks
XAUUSD
NAS100
USDJPY
I prodotti disponibili tramite cTrader Store, inclusi bot di trading, indicatori e plugin, sono forniti da sviluppatori terzi e resi disponibili esclusivamente a scopo informativo e di accesso tecnico. cTrader Store non è un broker e non fornisce consulenze in materia di investimento, raccomandazioni individualizzate o garanzie di risultati futuri.


![Logo di "[Stellar Strategies] Market Session Ultimate"](https://cdn.ctrader.com/image/webp/61ffd537-0125-4246-9e72-42eca1791d64_28232)


![Logo di "[Stellar Strategies] Inside Bar with Signals"](https://cdn.ctrader.com/image/webp/1d9e8bfa-3b2c-4440-bb37-5856902008a7_30683)

Prezzo
Da 27/02/2026
33.16K
Volume negoziato
25.96K
Profitto in pip
8
Vendite
386
Installazioni gratuite