설명
📊 Zofesu의 STVL Pro — SFP 트렌드 및 VWAP 유동성 감지.
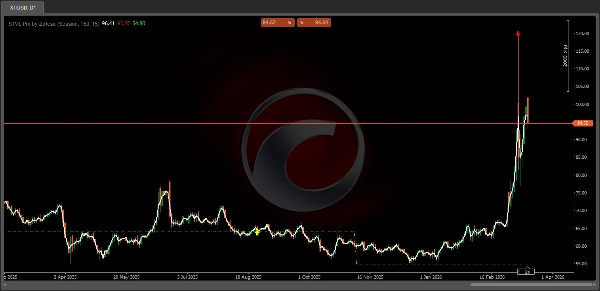
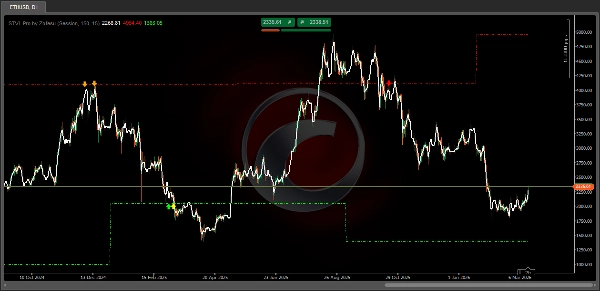
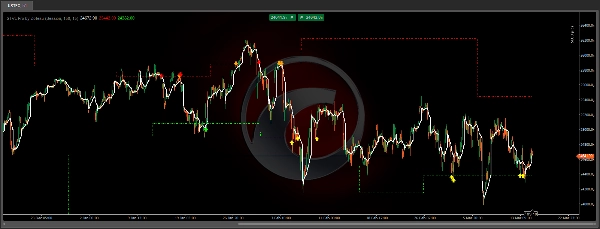
STVL Pro는 세 가지 강력한 개념을 하나의 깔끔한 도구로 결합한 정밀 오버레이 지표입니다: 세션 VWAP, 동적 스윙 유동성 레벨, 그리고 실시간 SFP(스윙 실패 패턴) 신호 감지.
⚙ 작동 원리
이 지표는 구성 가능한 되돌아보기 창 내에서 가장 높고 낮은 확정된 스윙 피벗 포인트를 지속적으로 추적합니다. 이 레벨들은 일반적으로 손절매와 유동성 클러스터가 위치하는 곳을 나타냅니다. 가격이 잠시 이 레벨 중 하나를 돌파했다가 다시 내부에서 마감할 때 — 전형적인 유동성 스윕 — SFP 신호가 발생합니다.
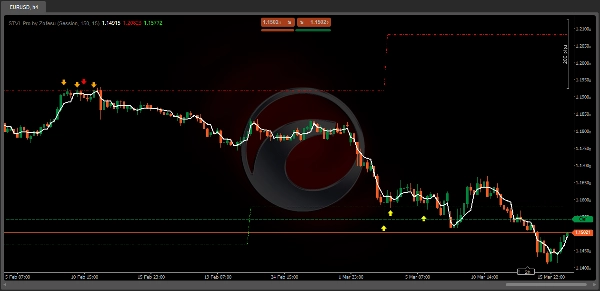
신호 색상은 한눈에 전체 상황을 알려줍니다:
녹색 화살표 (종가 > VWAP) — 강력한 상승 반전 신호
노란색 화살표 (종가 < VWAP) — 상승 스윕이지만 가치 영역 아래
빨간색 화살표 (종가 < VWAP) — 강력한 하락 반전 신호
주황색 화살표 (종가 > VWAP) — 하락 스윕이지만 가치 영역 위
참고: 현재(미마감) 바의 신호는 가격 변동에 따라 실시간으로 업데이트될 수 있습니다 — 이는 의도된 동작입니다. 형성 중인 신호는 시장이 아직 결정 중임을 나타냅니다. 최종 확인은 바 마감 시 이루어집니다.
🔑주요 기능
✅ 고정 VWAP — 세션, 주, 월 또는 연 단위로 리셋
✅ 동적 스윙 유동성 레벨 — 자동 업데이트되는 상단 및 하단 밴드
✅ SFP 감지 — 스윕 및 범위 내 재종가 확인
✅ VWAP 필터링된 신호 색상 — 가치와 함께 또는 반대로 거래 중인지 즉시 파악
✅ 구성 가능한 되돌아보기 (기본값 150 바)
✅ 확정된 바에서 제로 리페인트
✅ 경량 C# — 성능 영향 없음
📚사용 방법
1. STVL Pro를 원하는 차트와 시간대에 추가하세요
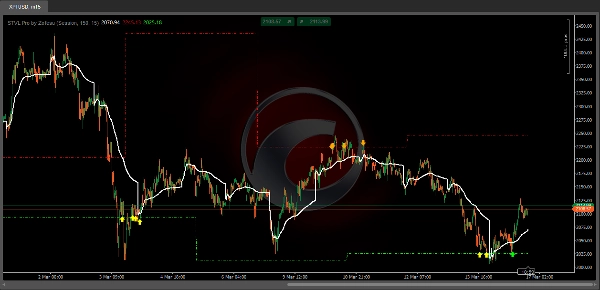
2. 점선 녹색/빨간색 수평선을 주시하세요 — 이것이 활성 유동성 레벨입니다
3. 캔들이 레벨을 돌파했다가 다시 내부에서 마감할 때까지 기다리세요
4. 화살표가 나타납니다 — 색상은 VWAP 대비 확신 수준을 알려줍니다
5. 단독 신호로 사용하거나 기존 전략과 결합하여 사용하세요
최적 결과: M15, H1, H4, D1
적용 가능: 지수(NAS100, SPX500), 외환, 금, 석유, 암호화폐
🔗매개변수
- VWAP 앵커 — 세션 / 주 / 월 / 연
- SFP 되돌아보기 — 스윙 고점/저점을 정의하는 바 수 (기본값 150)
- 레이블 오프셋 (핍) — 가격에서 화살표의 수직 거리
⚠️ 면책 조항
금융 상품 거래는 상당한 손실 위험을 수반합니다. 어떤 지표나 전략의 과거 성과가 미래 결과를 보장하지 않습니다. 이 도구는 정보 제공 및 교육 목적으로만 제공됩니다. 항상 적절한 위험 관리를 사용하고 감당할 수 있는 범위 내에서만 위험을 감수하세요. 저자는 이 지표 사용으로 인한 거래 손실에 대해 책임지지 않습니다.