
Açıklama
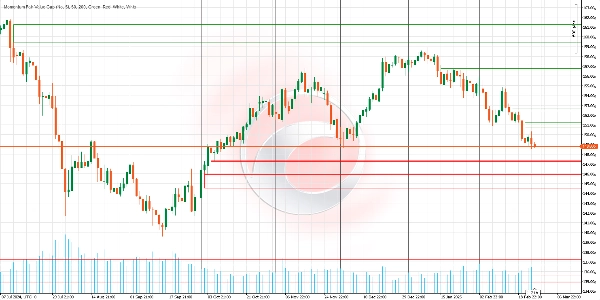
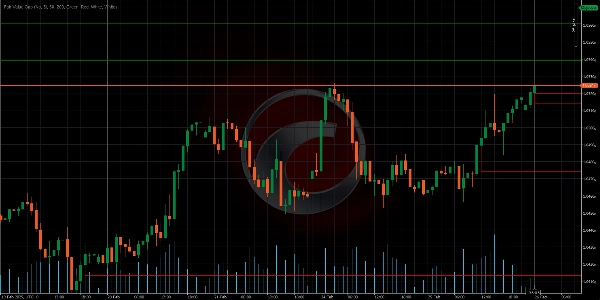
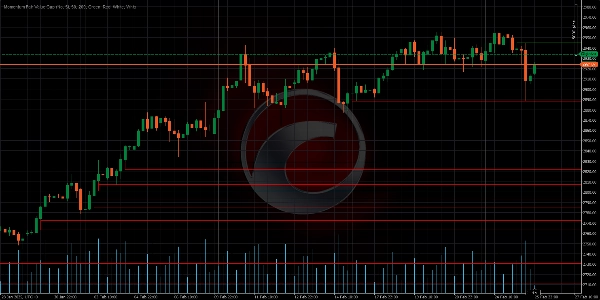
Piyasa dengesizliği alanlarını (Adil Değer Boşlukları veya FVG'ler) tanımlar ve bunları akıllıca grafik üzerinde projekte eder. Diğer göstergelerin aksine, bu gösterge fiyat hareketine gerçek zamanlı olarak uyum sağlar, boyutunu, kalıcılığını ve alaka düzeyini ayarlar. Net hedefler ve gelişmiş görsel boşluk yönetimi arayan traderlar için idealdir.
✨ ANA ÖZELLİKLER
- Dinamik Boşluk Ayarı
Mantık: Fiyat kısmen bir FVG'ye dokunursa (örneğin, alt sınırı hafifçe temas ederse), gösterge boşluğu sadece açığa çıkan alanı yansıtacak şekilde otomatik olarak yeniden boyutlandırır.
Fayda: Yanlış sinyallerden kaçınır ve sadece gerçek potansiyele sahip boşlukları aktif tutar. - Orta Nokta Doldurma
Mantık: Boşluğun ortasında bir çizgi çizer. Fiyat buna dokunursa, FVG "doldurulmuş" sayılır ve kaldırılabilir (ayar yapılabilir).
Fayda: Kapanışı onaylamak için sadece %50 temas gerektirir, gürültüyü ve erken işlemleri filtreler. - Doldurulana Kadar Sonsuz Projeksiyon
Mantık: Boşluklar geleceğe sonsuzca uzanır (X mumdan sonra kaybolmazlar).
Fayda: Piyasa dengesizliği çözene kadar kalıcı referans sağlar. - Geçersiz Boşlukların Otomatik Temizliği
Mantık: Eski boşlukları tamamen doldurulduğunda otomatik olarak kaldırır.
Fayda: Grafiği temiz ve aktif bölgelere odaklı tutar. - Gelişmiş Görsel Özelleştirme
Seçenekler: Boğa (yeşil) ve ayı (kırmızı) boşlukları için farklı renkler. Grafik karmaşasını önlemek için şeffaflık ayarı.
Fayda: Her türlü ticaret stiline veya görsel stratejiye uyum sağlar.
🎯 TİCARETTE NASIL KULLANILIR?
Ana Bölgelerin Tanımlanması:
- Boğa FVG (Yeşil): Alıcıların geçici olarak gücünü kaybettiği alan.
→ Strateji: Bu bölgeye geri çekilmelerde alım fırsatları arayın. - Ayı FVG (Kırmızı): Satıcıların geride kaldığı alan.
→ Strateji: Bu bölgeye yükselişlerde satış fırsatları arayın.
Fiyatla Etkileşim:
- Boşluk dinamik olarak ayarlanıyorsa (boyutu küçülüyorsa), piyasanın bölgeyi test ettiğini ancak onay olmadığını gösterir.
- Boşluk kaldırıldıysa (tam dolum veya Orta Nokta ile), dengesizliğin düzeltildiği kabul edilir.
🔍 DİĞER ARAÇLARLA ONAYLAMA
Sinyalleri filtrelemek için FVG'leri destek/dirençler, hacim veya RSI ile birleştirin.
📋 ÖZELLİK KARŞILAŞTIRMASI
___________________________________________________________________________________
Özellik Momentum Fair Value Gap Traditional Indicators
________________________________________________________________________________
Kalıcılık---------------- Boşlukları doldurulana kadar uzatır ----------------------- X mumdan sonra kaybolur
Kapanış Hassasiyeti-------- %50 onay seçeneği --------------------- Tam boşluk dolumu gerektirir
Esneklik ------------------ Fiyatla yeniden boyutlandırılır ------------------------- Statik ve değişmez seviyeler
Görsel Odak---------------- Alakasız boşlukları kaldırır ----------------------- Geçmiş verilerle grafiği karıştırır
📝 PRATİK ÖRNEK
EURUSD Senaryosu (1H):
Belirgin bir ayı mumundan sonra bir Boğa FVG (yeşil) oluşur. Günler sonra fiyat geri çekilir, boşluğun alt sınırına dokunur ancak doldurmaz. Gösterge boşluk boyutunu otomatik olarak küçültür. Son olarak, fiyat Orta Noktaya (orta çizgi) dokunur ve bu da boşluğun kaldırılmasını tetikler. Trader, bölgede reddi onayladıktan sonra kısa pozisyona girer.
Ctrader Store göstergeleri:
Dynamic Market Structure
Analysis of Turning Points
Fibonacci Linear
Regression Multi-timeframe
Multi-Level Candle Bias
Tracker
Auto Support and
Resistance Trend Lines
Özet
Key features include:
- Dynamic Gap Adjustment: Automatically resizes gaps when price partially touches them, reducing false signals.
- MidPoint Fill: Marks the gap centerline; if price touches it, the gap is considered filled and can be removed, requiring only 50% contact for confirmation.
- Infinite Projection: Gaps extend indefinitely until filled, maintaining persistent market imbalance references.
- Automatic Cleanup: Removes fully filled gaps to keep charts focused on active zones.
- Advanced Visual Customization: Uses distinct colors for bullish (green) and bearish (red) gaps with adjustable transparency.
In trading, bullish FVGs indicate zones where buyers lost strength, suggesting buying opportunities on pullbacks; bearish FVGs mark where sellers were overtaken, indicating selling opportunities on rallies. The indicator’s dynamic interaction with price helps confirm market imbalance resolution.
It is recommended to combine this indicator with other tools like support/resistance levels, volume, or RSI for signal filtering.
Müşteri değerlendirmeleri
5 | 0 % | |
4 | 100 % | |
3 | 0 % | |
2 | 0 % | |
1 | 0 % |


!["[Hamster-Coder] Pivot Points MTF" logosu](https://cdn.ctrader.com/image/webp/4c143e5a-309c-40e3-a578-f04d1e133ffa_31159)


