
Inside Candle
Indikator
1 pembelian
Versi 1.0, Oct 2025
Windows, Mac
5.0
Ulasan: 2
Sejak 11/10/2025
2.55M
Volum yang didagangkan
17.52K
Pip dimenangi
1
Jualan
231
Pemasangan percuma
Penerangan
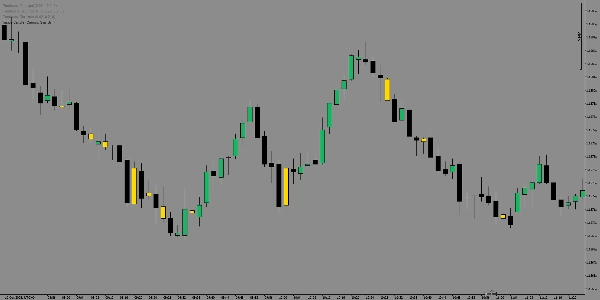
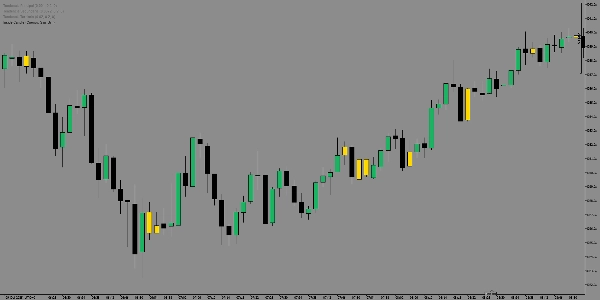
Kenal pasti zon pecahan yang kuat dan penggabungan pasaran dengan ketepatan menggunakan Penunjuk Lilin Dalam.
Alat ini menyerlahkan setiap corak Bar Dalam — saat-saat apabila volatiliti mengecut dan pasaran bersedia untuk pergerakan meletup.
Dengan mengesan bila tinggi dan rendah lilin sepenuhnya terkandung dalam lilin sebelumnya, ia menandakan secara visual kawasan pengumpulan atau ketidaktentuan, membantu anda menjangka titik pecahan berpotensi sebelum ia berlaku.
Gunakan ia untuk:
- Mengesan persediaan kesinambungan tren dan pembalikan awal.
- Menapis dagangan mengikut zon mampatan volatiliti.
- Segera mengenal pasti bila pasaran sedang “mengumpul tenaga” untuk pergerakan seterusnya.
Bersih, tepat, dan intuitif secara visual — Penunjuk Lilin Dalam menukar struktur pasaran yang kompleks menjadi pandangan visual yang mudah.
Ringkasan
Ringkasan AI
The Inside Candle indicator identifies Inside Bar patterns by detecting when a candle’s high and low are fully contained within the previous candle. This highlights zones of market consolidation and volatility contraction, signaling potential breakout points. It visually marks areas of accumulation or indecision, helping traders anticipate trend continuations or early reversals. The indicator supports markets including Forex, commodities, indices, and symbols such as EURUSD, GBPUSD, USDJPY, BTCUSD, XAUUSD, and NAS100. Key features include filtering trades by volatility compression zones and providing clear, intuitive visual cues to recognize when the market is preparing for significant moves. This tool is designed to simplify complex market structures into actionable insights for breakout and trend-following strategies.
Profil indikator
Ulasan pelanggan
5.0
Ulasan: 2
5 | 100 % | |
4 | 0 % | |
3 | 0 % | |
2 | 0 % | |
1 | 0 % |
Ulasan pelanggan
October 22, 2025
October 21, 2025
The better read comes from the process slows down in a good way. It should stay in the support stack.
Perbincangan
Soalan Lazim
BTCUSD
Forex
Signal
Breakout
Indices
EURUSD
Commodities
GBPUSD
NZDUSD
RSI
Fibonacci
Scalping
XAUUSD
NAS100
ATR
MACD
USDJPY
VWAP
Produk yang tersedia melalui cTrader Store, termasuk bot dagangan, indikator dan plugin, disediakan oleh pembangun pihak ketiga dan diberikan akses untuk tujuan maklumat dan teknikal sahaja. cTrader Store bukan broker dan tidak memberikan nasihat pelaburan, syor peribadi atau sebarang jaminan prestasi masa hadapan.
Lebih banyak produk daripada penulis ini


Harga
Sejak 11/10/2025
2.55M
Volum yang didagangkan
17.52K
Pip dimenangi
1
Jualan
231
Pemasangan percuma