
Supertrend Indicator v1.1
Gösterge
32 satın almalar
Sürüm 1.2, Feb 2026
Windows, Mac
4.3
Değerlendirmeler: 3
Açıklama
Vitrin:
Supertrend Göstergesi – piyasa trendlerini kolayca takip etmeyi ve daha akıllı yatırım kararları almayı sağlayan, tüccarlar için vazgeçilmez bir araç! Bu sezgisel, profesyonel düzeyde gösterge, ister yeni başlıyor olun ister deneyimli bir yatırımcı, net alım ve satım sinyalleri vermek üzere tasarlanmıştır.
Neden Supertrend Göstergesini Seçmelisiniz?
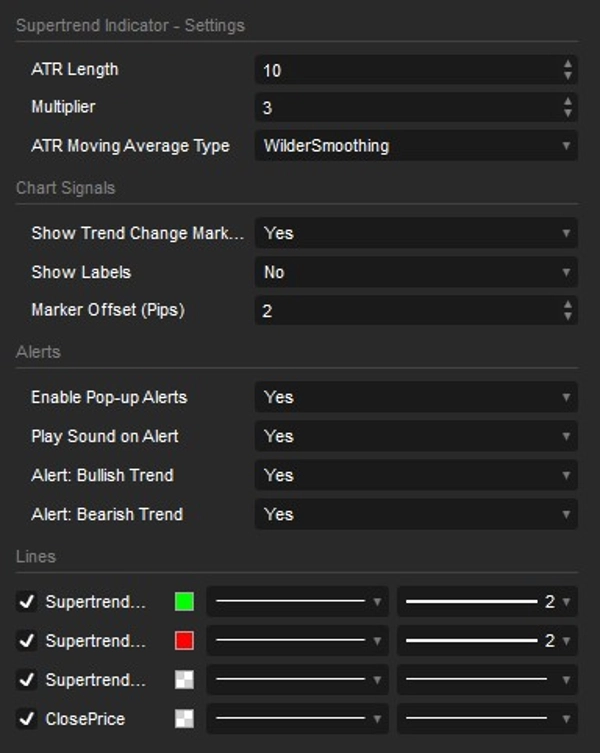
- Sektör Standardı Doğruluk: Şimdi özelleştirilebilir ATR Hareketli Ortalama Türleri (Wilder'ın Düzleştirmesi dahil) ile. TradingView gibi en popüler premium Supertrend versiyonlarıyla aynı şekilde hesaplar ve tepki verir!
- %100 Yeniden Çizilmeyen: Sağlam bir trend hafızası mekanizması ile inşa edilmiştir. Bir trend değiştiğinde ve bir sinyal verildiğinde, orada kalır. Yeniden çizme, kaybolan oklar veya grafik geçmişinde gezinirken yeniden hesaplama hatası yoktur.
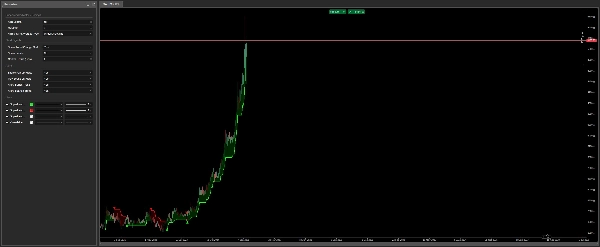
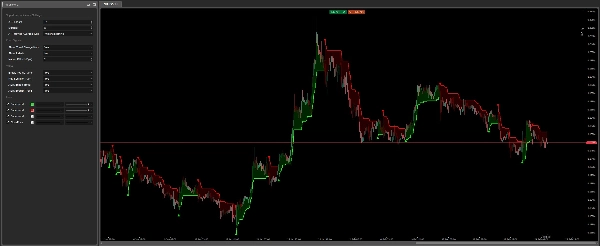
- Basitlik ve Etkinlik: Gösterge, piyasa yükseldiğinde (alım sinyali) yeşile, düştüğünde (satım sinyali) kırmızıya dönen otomatik bir Supertrend çizgisi çizer. Trendin hangi yönde olduğunu her zaman tam olarak bileceksiniz.
- Akıllı Gerçek Zamanlı Bildirimler: Hiçbir ticaret fırsatını kaçırmayın! Gösterge, yerel cTrader Pop-up'ları ve entegre ses efektleri kullanan geliştirilmiş bir uyarı sistemi içerir. Ayrıca, dahili spam koruması sayesinde gerçek zamanlı bir sinyal oluştuğunda yalnızca bir kez uyarılırsınız—grafikler yüklenirken veya yeniden yüklenirken rahatsız edici ses spamı olmaz.
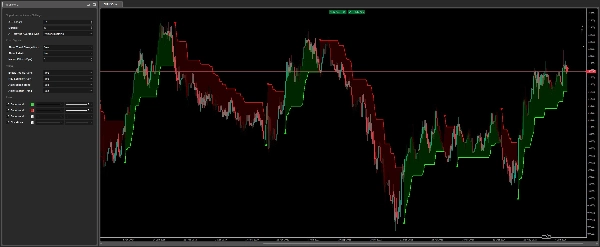
- Gelişmiş Görsel Sinyaller ve Bulut Dolgusu: Her önemli trend değişiminde, dikkat çekici oklar ve isteğe bağlı "Boğa"/"Ayı" metin etiketleri görürsünüz. Supertrend çizgisi ile fiyat arasındaki ince, dinamik bulut dolgusu, piyasa momentumunu kolayca kavramanızı sağlar.
- Tamamen Özelleştirilebilir ve Hassas: ATR Uzunluğu ve Çarpanı gibi temel ayarları kolayca ayarlayın. Ayrıca, oklar ve etiketlerin mesafesini dinamik Pip tabanlı ofsetlerle hassas şekilde kontrol ederek, her varlıkta mükemmel ve düzenli görseller elde edebilirsiniz.
Supertrend Göstergesi, piyasa analizini basitleştirmek isteyen herkes için mükemmeldir – trendleri kolayca tespit etmek isteyen yeni başlayan tüccarlardan, stratejileri için yüksek hassasiyetli, yeniden çizilmeyen sinyaller arayan deneyimli profesyonellere kadar. Forex, Hisse Senetleri, Endeksler, Kripto Paralar gibi her piyasada ve tüm zaman dilimlerinde kusursuz çalışır.
Özet
YZ özeti
The Supertrend Indicator v1.1 is a professional-grade trading tool designed to identify market trends and provide clear buy and sell signals. It features customizable ATR moving average types, including Wilder's smoothing, ensuring accuracy comparable to leading platforms. The indicator is 100% non-repainting, maintaining stable signals without recalculation errors or disappearing markers. It visually represents trends with a line that turns green during upward movements and red during downward trends, complemented by arrows, optional "Bullish"/"Bearish" labels, and a dynamic cloud fill to highlight market momentum. Real-time alerts use native cTrader pop-ups and sound effects with built-in spam protection, notifying users once per signal. Users can adjust key parameters such as ATR length, multiplier, and visual offsets for precise, uncluttered display across all asset types. The Supertrend Indicator supports multiple markets including Forex, Stocks, Indices, and Cryptocurrencies, and is suitable for all timeframes. It is designed for traders of all experience levels seeking a reliable, easy-to-interpret trend analysis tool.
Gösterge profili
Müşteri değerlendirmeleri
4.3
Değerlendirmeler: 3
5 | 33 % | |
4 | 67 % | |
3 | 0 % | |
2 | 0 % | |
1 | 0 % |
Müşteri değerlendirmeleri
November 4, 2025
Smooth and steady - Supertrend v1.1 keeps you riding the trend with confidence. Clear color switches show when momentum flips, helping you enter early and exit smart. Fast, reliable, and a classic trend tool that belongs in every trader’s arsenal. Pairs perfectly with momentum filters or ATR-based setups for precision entries!
August 6, 2025
Tartışma
SSS
Signal
Indices
Commodities
GBPUSD
RSI
Bollinger
Fibonacci
Scalping
AI
XAUUSD
NAS100
MACD
BTCUSD
Forex
Breakout
EURUSD
NZDUSD
Martingale
Prop
ZigZag
Supertrend
Fair Value Gap
SMC
Crypto
Grid
Stocks
ATR
USDJPY
VWAP
cTrader Store üzerinden erişilebilen işlem botları, göstergeler ve eklentiler gibi ürünler, üçüncü taraf sağlayıcılar tarafından sağlanır ve yalnızca bilgilendirme ve teknik erişim amaçlarıyla sunulur. cTrader Store bir broker değildir ve yatırım tavsiyesi, kişisel öneriler vermez veya gelecekteki performansı garanti etmez.


Fiyat
89
Satışlar
150
Ücretsiz yüklemeler