Açıklama
Trendline Göstergesi Nedir?
Trendline göstergesi, tüccarlar ve analistler tarafından finansal bir piyasadaki trendin yönünü ve gücünü belirlemek için kullanılan teknik analiz aracıdır. Bir grafikte iki veya daha fazla fiyat noktasını birleştiren düz bir çizgi çizilmesine dayanır. Trendline'ın temel amacı, belirli bir dönem boyunca fiyat hareketinin genel yönünü görsel olarak temsil etmektir.
Çoklu Zaman Dilimi Trendline Göstergesi
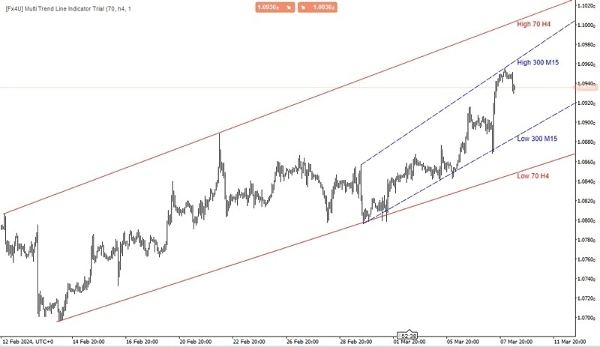
Çoklu zaman dilimi trendline göstergesinin temel işlevi, tüccarlara çeşitli zaman dilimlerinden bilgi toplayarak piyasa trendlerine daha geniş bir bakış açısı sağlamaktır. Birden fazla zaman dilimindeki trendleri analiz ederek, tüccarlar potansiyel giriş ve çıkış noktaları ile piyasanın genel yönü hakkında daha bilinçli kararlar verebilirler.
Bu tür bir gösterge genellikle tüccarların analiz etmek istedikleri zaman dilimlerini özelleştirmelerine ve buna göre trendline çizgileri çizmelerine olanak tanır. Farklı zaman dilimlerinde önemli destek ve direnç seviyelerini, trend dönüşlerini ve trend devamlarını belirlemek için değerli bir araç olabilir; böylece tüccarların daha doğru ticaret kararları almalarına yardımcı olur.
Trendline türleri şunlardır:
- Yükselen Trendline: Bu, bir fiyat grafiğinde iki veya daha fazla ardışık dip noktayı birleştirerek çizilir. Fiyatların genel olarak zamanla yükseldiğini gösteren bir yükseliş trendini ifade eder.
- Düşen Trendline: Buna karşılık, düşen trendline, bir fiyat grafiğinde iki veya daha fazla ardışık tepe noktasını birleştirerek çizilir. Fiyatların genel olarak zamanla düştüğünü gösteren bir düşüş trendini ifade eder.
- Yatay Trendline: Destek veya direnç çizgileri olarak da bilinen bu çizgiler, fiyat hareketinin duraklama veya dönüş eğiliminde olduğu alanları göstermek için yatay olarak çizilir.
Tüccarlar, trendline'ları genellikle diğer teknik göstergeler ve analiz yöntemleriyle birlikte kullanarak bilinçli ticaret kararları verirler. Bir trendline kırıldığında veya aşıldığında, bu trendin yönünde potansiyel bir değişikliği gösterebilir ve yatırımcılara ticaret sinyalleri sağlayabilir.
Diğer ürünlerim:
https://ctrader.com/products/346
https://ctrader.com/products/336
https://ctrader.com/products/343
https://ctrader.com/products/347
https://ctrader.com/products/148
Özet
This multi-timeframe indicator aggregates trend information across customizable timeframes, providing a comprehensive market overview. It supports the identification of upward, downward, and horizontal trendlines, which correspond to rising trends, falling trends, and support or resistance levels, respectively. By integrating trendlines from various timeframes, traders can better detect trend continuations, reversals, and key support/resistance zones.
The indicator assists in making informed trading decisions by highlighting potential entry and exit points based on trendline breaks or breaches. It is intended for use alongside other technical indicators and analysis methods to enhance market interpretation and trading accuracy.
Müşteri değerlendirmeleri
5 | 67 % | |
4 | 0 % | |
3 | 33 % | |
2 | 0 % | |
1 | 0 % |
!["[Fx4U] GBPUSD - Price Action" logosu](https://cdn.ctrader.com/image/webp/d80b34fc-da3c-4f01-a321-456450665649_26190)

!["[Fx4U] CADJPY - Price Action" logosu](https://cdn.ctrader.com/image/webp/1ba81247-b6b7-4f3c-a297-fa3eb1d57fe1_26195)

!["[Fx4U] AUDCHF - Price Action" logosu](https://cdn.ctrader.com/image/webp/0a22e9aa-c83b-42cd-b0b8-c1a2da593207_26148)

!["[Fx4U] EURAUD - Price Action" logosu](https://cdn.ctrader.com/image/webp/baf8dde4-1ef3-4beb-8ae2-0fed8320f65d_26177)