Açıklama
Çoklu zaman dilimi destek ve direnç göstergeleri genellikle tüccarların bu seviyeleri saatlik, günlük, haftalık veya aylık grafikler gibi farklı zaman dilimlerinde görselleştirmesine olanak tanır. Birden fazla zaman dilimini dahil ederek, tüccarlar önemli fiyat seviyelerinin nerede olduğunu ve fiyat hareketini nasıl etkileyebileceğini daha geniş bir perspektiften görebilirler.
Bu tür bir gösterge, tüccarların çeşitli zaman dilimlerinde fiyat hareketlerini etkileyebilecek önemli destek ve direnç seviyelerini belirleyerek daha bilinçli ticaret kararları almalarına yardımcı olabilir. Ayrıca, fiyat bu seviyelere birden fazla zaman diliminde yaklaştığında potansiyel dönüşleri veya kırılma fırsatlarını tahmin etmelerine yardımcı olabilir.
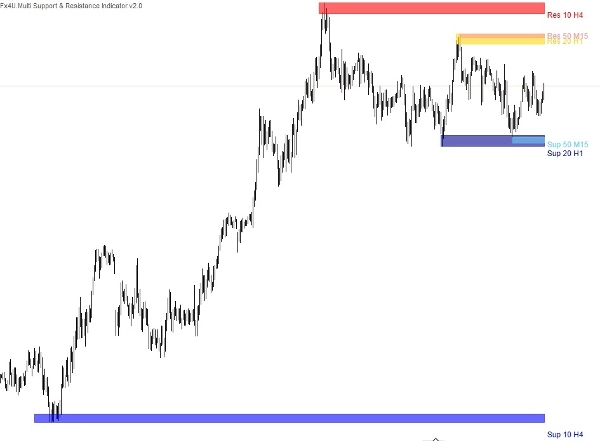
Üç tür destek ve direnç seviyesi vardır:
Bu tek göstergeye entegre edilmiş üç destek ve direnç göstergesi, arz ve talep bölgelerinizi aşağıdaki ayarlarla grafik üzerine çizmenize olanak tanır.
- Dönem değeri.
- Zaman dilimi.
- Ekstremum sayısı – Bu, gösterilen mevcut + geçmiş Destek/Direnç noktalarının sayısıdır. Örneğin, 2 seçersek, gösterge geçmişte başka bir Destek ve Direnç noktası seçecektir.
- Gösterge adı ve rengi.
Daha yüksek zaman dilimlerinde önemli olan destek ve direnç seviyeleri genellikle daha fazla ağırlık taşır ve çoklu zaman dilimi göstergesi kullanarak, tüccarlar bir seviyenin birden fazla zaman diliminde tutarlı bir şekilde görünmesi durumunda önemini teyit edebilirler. Bu teyit, seviyenin güvenilirliğini artırır ve tüccarların ticaret kararlarına olan güvenini güçlendirir.
Diğer ürünlerim:
https://ctrader.com/products/346
https://ctrader.com/products/336
https://ctrader.com/products/343
https://ctrader.com/products/347
https://ctrader.com/products/147
Özet
The indicator consolidates three types of support and resistance levels into a single tool, allowing users to plot supply and demand zones with customizable settings such as period value, timeframe, the number of extremum points (current plus past support/resistance points), and indicator name and color. This multi-timeframe approach helps traders identify levels that carry more weight when confirmed across different timeframes, enhancing the reliability of these levels for decision-making.
By visualizing these critical zones, the indicator aids in anticipating potential price reversals or breakout opportunities. It supports a broader market overview, enabling more informed trading strategies based on the interaction of price with established support and resistance across various time horizons.
Müşteri değerlendirmeleri
5 | 33 % | |
4 | 67 % | |
3 | 0 % | |
2 | 0 % | |
1 | 0 % |
!["[Fx4U] GBPUSD - Price Action" logosu](https://cdn.ctrader.com/image/webp/d80b34fc-da3c-4f01-a321-456450665649_26190)

!["[Fx4U] CADJPY - Price Action" logosu](https://cdn.ctrader.com/image/webp/1ba81247-b6b7-4f3c-a297-fa3eb1d57fe1_26195)

!["[Fx4U] AUDCHF - Price Action" logosu](https://cdn.ctrader.com/image/webp/0a22e9aa-c83b-42cd-b0b8-c1a2da593207_26148)

!["[Fx4U] EURAUD - Price Action" logosu](https://cdn.ctrader.com/image/webp/baf8dde4-1ef3-4beb-8ae2-0fed8320f65d_26177)