
Frac Support Resistance V1
Gösterge
2 satın almalar
Sürüm 1.0, Nov 2025
Windows, Mac
5.0
Değerlendirmeler: 1
Açıklama
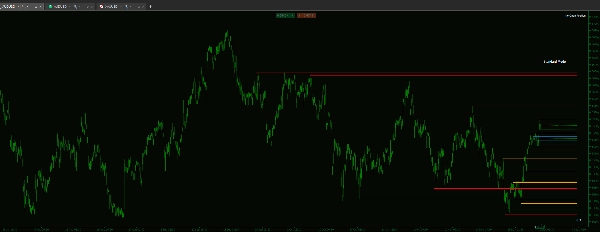
Eğer piyasa yapısına göre işlem yapıyorsanız, en kritik seviyelerin genellikle daha yüksek zaman diliminde belirlendiğini bilirsiniz. Bu özel gösterge, bu seviyeleri manuel olarak tanımlama ve takip etme zorluğunu çözüyor.
Bu araç, kritik yapısal sınırları görmenizi ve yüksek değerli bölgeleri önceliklendirmenizi sağlayan güvenilir bir görsel hiyerarşi sunmak için tasarlanmıştır; böylece işlem ekranınızı terk etmeden çalışabilirsiniz.
Ana Özellikler ve Ayrıntılı Kontrol
- Gösterge, olağanüstü performans ve temiz grafik görselleştirmesi için tasarlanmıştır:
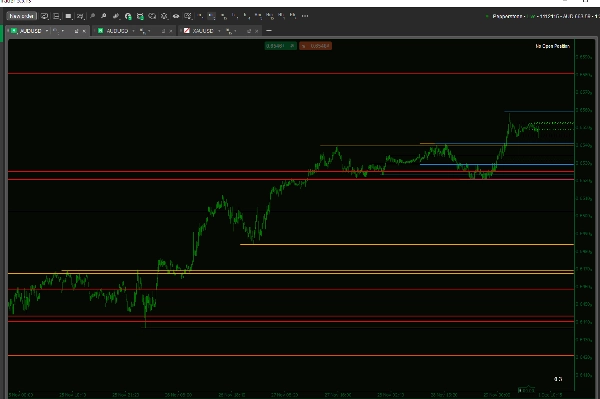
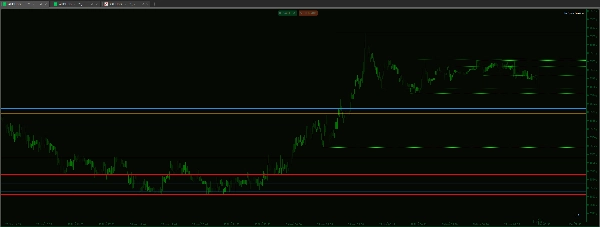
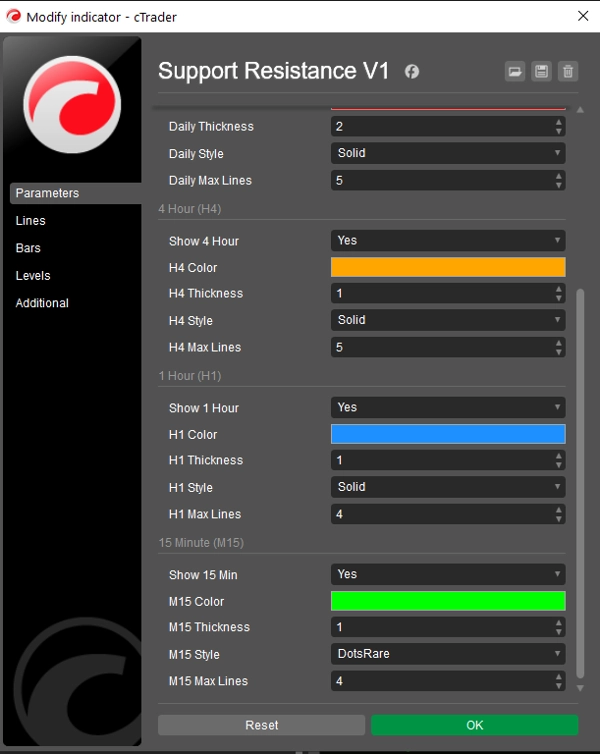
- Gerçek Görsel Hiyerarşi: Her zaman dilimi için kalınlık, çizgi stili (Düz, Kesik, Noktalı) ve renk üzerinde bağımsız kontrol elde edin.
- Fayda: Bir seviyenin gücünü sadece görünüşünden hemen tanıyın (örneğin, ana yapılar için D1 çizgilerini Kalın/Düz, anlık seviyeler için H1 çizgilerini İnce/Noktalı olarak ayarlayın).
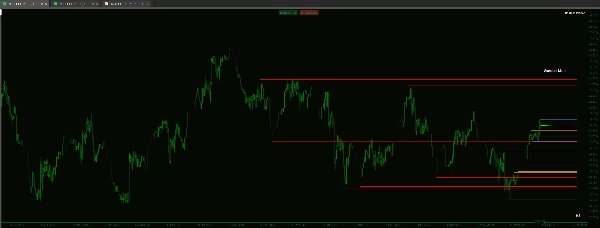
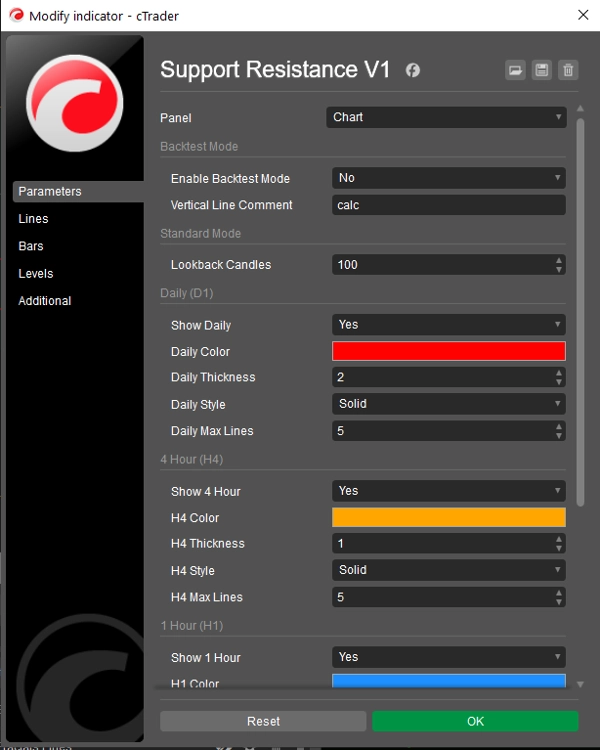
- Performans ve Odak Kontrolü: Karışık grafiklerden bıktınız mı? Her zaman dilimi için gösterilen Maksimum Çizgi Sayısını ayrı ayrı sınırlayabilirsiniz.
- Örnek: H4 Maks Çizgi sayısını 5, D1 Maks Çizgi sayısını 15 olarak ayarlayarak, alt zaman dilimlerindeki güncel seviyeleri önceliklendirirken ana yapıları daha derin bir şekilde görüntüleyin.
- Temiz Kod Temeli: Güvenilir fraktal mantığı üzerine kuruludur, böylece tanımlanan seviyeler standart yapı analizinde kullanılan gerçek yüksek/düşük pivotlardır.
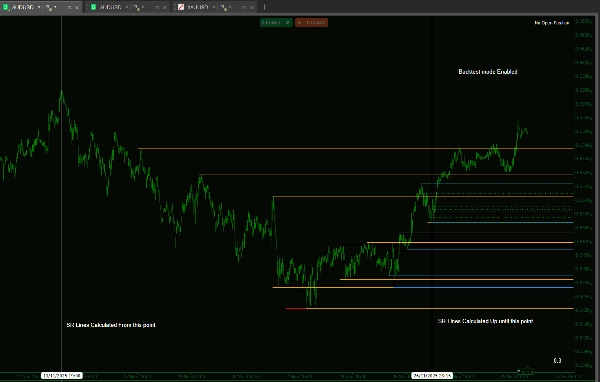
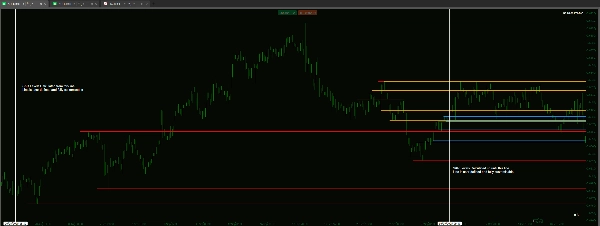
- Özel Geri Test Modu: Gösterge analizini grafik üzerinde belirli, tanımlı bir zaman aralığı ile sınırlayan bir fonksiyon içerir. Bu, geleceğe yönelik önyargı olmadan zaman ilerlemesini simüle ederek doğru manuel geri test için gereklidir.
Özet
YZ özeti
Frac Support Resistance V1 is a technical indicator designed to automatically calculate and display smart support and resistance lines derived from multiple timeframes: daily (D1), 4-hour (H4), hourly (H1), and 15-minute (M15). It assists traders who rely on market structure by visually highlighting critical price levels established on higher timeframes, reducing the need for manual identification.
Key features include customizable visual hierarchy, allowing independent adjustment of line thickness, style (solid, dashed, dotted), and color for each timeframe. This enables quick recognition of the relative strength of support and resistance levels. Users can also control chart clarity by setting maximum numbers of lines per timeframe to prioritize recent or major structural levels.
The indicator is based on fractal logic to identify genuine high and low pivots consistent with standard market structure analysis. It includes a dedicated backtesting mode that restricts analysis to a specified historical period, facilitating unbiased manual strategy testing by simulating real-time progression.
Frac Support Resistance V1 supports various markets including Forex, cryptocurrencies, commodities, indices, and stocks, with tags indicating compatibility with symbols like BTCUSD, EURUSD, GBPUSD, XAUUSD, NAS100, and USDJPY. The tool is suited for strategies involving breakout, scalping, smart money concepts, and grid trading.
Gösterge profili
Müşteri değerlendirmeleri
5.0
Değerlendirmeler: 1
5 | 100 % | |
4 | 0 % | |
3 | 0 % | |
2 | 0 % | |
1 | 0 % |
Müşteri değerlendirmeleri
December 1, 2025
A small account test feels safer, and the plan becomes easier to stick with, and the chart still needs a final look.
Tartışma
SSS
BTCUSD
Forex
Signal
Breakout
Indices
EURUSD
Commodities
GBPUSD
NZDUSD
Prop
Scalping
SMC
Crypto
Grid
Stocks
AI
XAUUSD
NAS100
USDJPY
cTrader Store üzerinden erişilebilen işlem botları, göstergeler ve eklentiler gibi ürünler, üçüncü taraf sağlayıcılar tarafından sağlanır ve yalnızca bilgilendirme ve teknik erişim amaçlarıyla sunulur. cTrader Store bir broker değildir ve yatırım tavsiyesi, kişisel öneriler vermez veya gelecekteki performansı garanti etmez.


Fiyat
Başlangıç 14/01/2025
55
Satışlar
11.5K
Ücretsiz yüklemeler