
RSI Advanced
Indicador
1 compras
Versão 1.0, Apr 2026
Windows, Mac
5.0
Avaliações: 1

Descrição
O Índice de Força Relativa (RSI) padrão é um dos indicadores mais populares do mundo, mas traçar uma única linha na parte inferior do seu gráfico é uma forma ultrapassada de negociar. Isso dificulta identificar verdadeiras mudanças de momentum, aceleração e movimentos laterais do mercado.
O RSI Advanced reinventa completamente este oscilador clássico. Ao introduzir uma Linha de Sinal, Filtragem de Volatilidade e Pintura Inteligente do Gráfico, ele transforma o RSI em um painel abrangente, tudo-em-um, de momentum e acompanhamento de tendência.
Principais Características
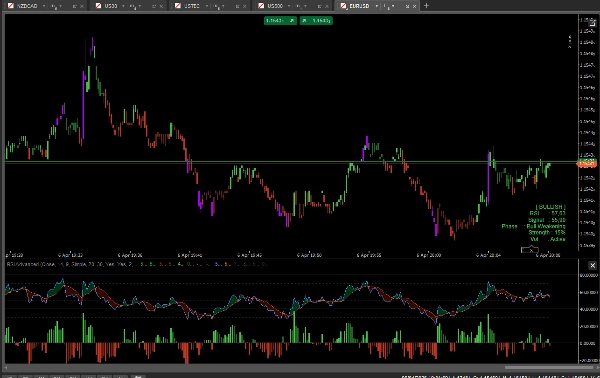
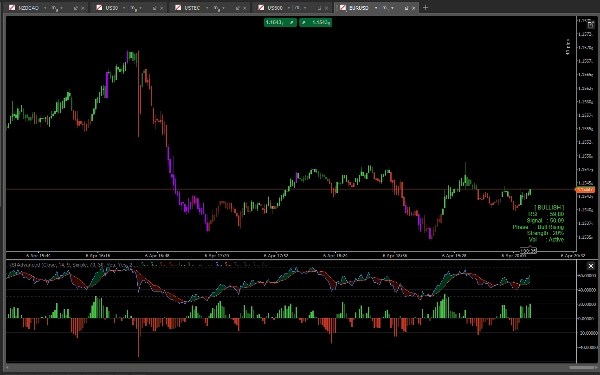
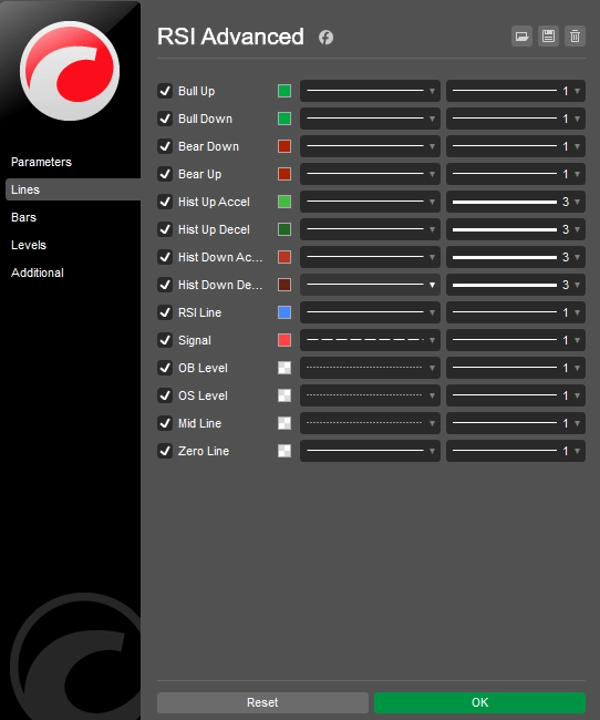
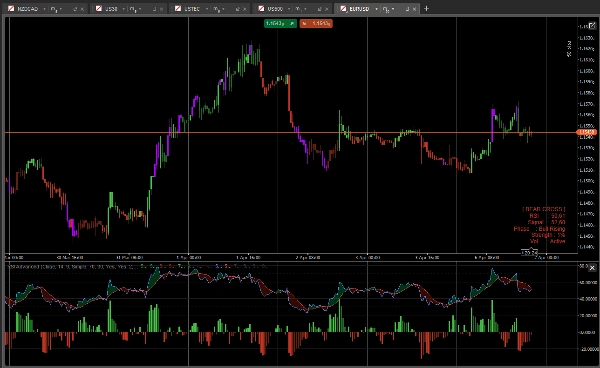
- RSI & Nuvem de Sinal: Adicionamos uma Média Móvel (Linha de Sinal) ao RSI. O espaço entre o RSI e sua Linha de Sinal é preenchido com uma Nuvem dinâmica. Se a nuvem estiver Verde, os touros estão conduzindo o momentum. Se estiver Vermelha, os ursos estão no controle.
- Histograma de Momentum: Um histograma centralizado acompanha a distância exata entre o RSI e a Linha de Sinal. Com cores embutidas de aceleração/desaceleração (claro vs. escuro), você pode antecipar cruzamentos e exaustão do momentum antes que aconteçam.
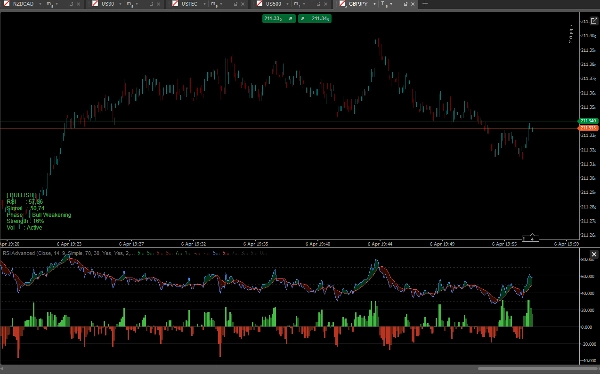
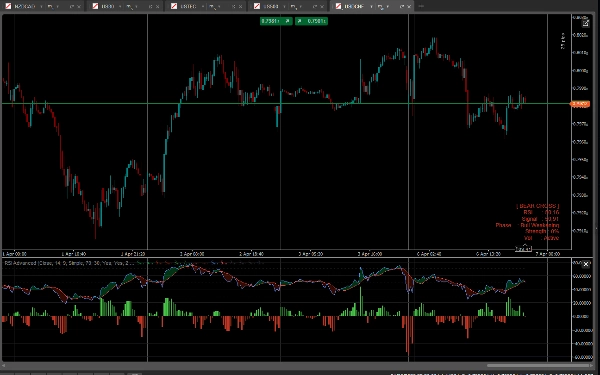
- Coloração Inteligente das Barras (Paintbars): Seus candles mudarão de cor com base no momentum subjacente do RSI:
-
- Verde/Vermelho Claro: Forte alinhamento altista/baixista (RSI > 50 e RSI > Sinal).
- Verde/Vermelho Escuro: Momentum fraco ou retrações.
- Roxo/Magenta: Níveis extremos de Sobrecompra (OB) ou Sobrevenda (OS) – alertando sobre potenciais reversões.
- Filtro Inteligente de Volatilidade (ATR): Cansado de ser pego em mercados laterais? Ative o filtro ATR embutido. Quando a volatilidade cai abaixo da sua média histórica, os candles e o histograma ficam cinza, mantendo você fora de negociações ruins.
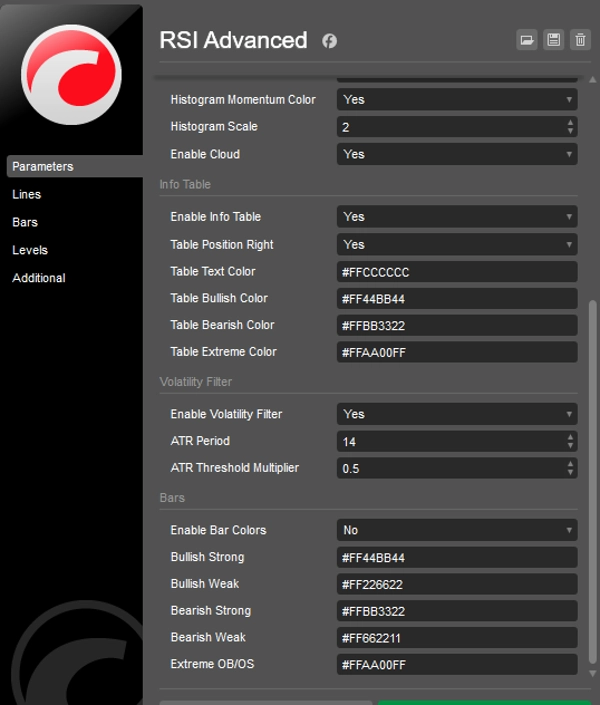
- Painel de Informações no Gráfico: Um painel elegante exibe métricas em tempo real: valores exatos do RSI e do Sinal, Fase do Momentum, porcentagem de Força da Tendência e Status da Volatilidade.
- Completamente Desbloqueado: Negocie em QUALQUER símbolo (Forex, Cripto, Índices, Ações) e QUALQUER período de tempo sem limitações. Acesso vitalício.
Como negociar com ele?
- Continuação de Tendência: Procure por retrações onde o RSI permanece acima da Linha Média 50, mas mergulha ligeiramente na Linha de Sinal. Quando o Histograma acelera (verde claro) e os candles ficam verde claro, é uma entrada forte de continuação.
- Reversões: Quando os candles ficam Roxos (OB/OS extremos), espere o RSI cruzar de volta a Linha de Sinal (a Nuvem muda de cor) para uma configuração de reversão de alta probabilidade.
- Evitar Movimentos Laterais: Se o Filtro de Volatilidade deixar suas barras cinzas, simplesmente fique parado e espere o mercado acordar.
Resumo
Perfil do indicador
Categoria do indicador
Volatilidade
Tipo de resultado
Filtro
Requisitos de dados
Apenas barras
Sinais suportados
Cruzamento
Força da tendência
Volatilidade
Avaliações de clientes
5.0
Avaliações: 1
5 | 100 % | |
4 | 0 % | |
3 | 0 % | |
2 | 0 % | |
1 | 0 % |
Avaliações de clientes
April 11, 2026
The first thing that worked was timing feels less random, and a small account test feels safer.
Conversa
Perguntas frequentes
BTCUSD
Forex
Signal
Indices
EURUSD
Commodities
GBPUSD
NZDUSD
RSI
AI
XAUUSD
NAS100
ATR
USDJPY
Os produtos disponíveis através da cTrader Store, incluindo bots de negociação, indicadores e plugins, são fornecidos por programadores terceiros e são disponibilizados apenas para fins informativos e de acesso técnico. A cTrader Store não é um corretor e não fornece aconselhamento em matéria de investimento, recomendações pessoais ou qualquer garantia de desempenho no futuro.


Preço
24
Vendas
661
Instalações gratuitas