
HLC_Levels
Indicador
4 compras
Versão 1.0, Feb 2026
Windows, Mac
4.3
Avaliações: 3
Descrição
Descrição:
Pare de desenhar linhas manualmente todos os dias. Níveis Avançados HLC & de Sessão é um indicador abrangente projetado para traders profissionais que dependem de pontos de referência institucionais. Seja você um trader de Price Action, conceitos ICT ou estratégias de Breakout, esta ferramenta mantém seu gráfico limpo e seus níveis precisos.
Principais Características:
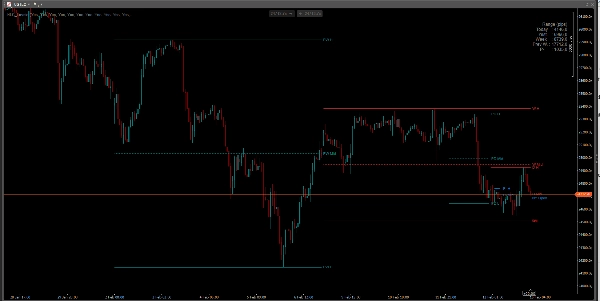
- Níveis Diários: Exibe automaticamente os níveis de Alta, Baixa e Média (50%) de Hoje e de Ontem.
- Níveis Semanais: Visualiza os níveis de Alta, Baixa e Média da Semana Atual e da Semana Anterior.
- Abertura da Meia-Noite de NY: Um botão dedicado para o nível de preço institucional de Nova York às 00:00 (Abertura Verdadeira do Dia), crucial para o viés direcional.
- Intervalo / Sessão Personalizada: Defina sua própria janela de tempo (por exemplo, Sessão Ásia, Abertura de Londres ou Balanço Inicial). O indicador desenhará a Alta, Baixa e Média para esse período específico.
- Painel de Volatilidade: Uma tabela no gráfico mostrando a faixa de pips (Alta menos Baixa) para o Dia, Ontem, Semana, Semana Anterior e seu Intervalo Personalizado.
- Inteligência de Fuso Horário: Funciona com o horário do Corretor, UTC, NY ou horário Local para garantir que os níveis estejam alinhados com sua estratégia.
Por que usar este indicador?
- Pontos de Reação: Altas/Baixas antigas e pontos médios frequentemente atuam como fortes suportes e resistências.
- Média (Equilíbrio): O nível de 50% é fundamental para identificar preços "Desconto" versus "Prêmio".
- Totalmente Personalizável: Ative ou desative qualquer linha. Altere cores, estilos de linha e posições de rótulo para combinar com seu modelo.
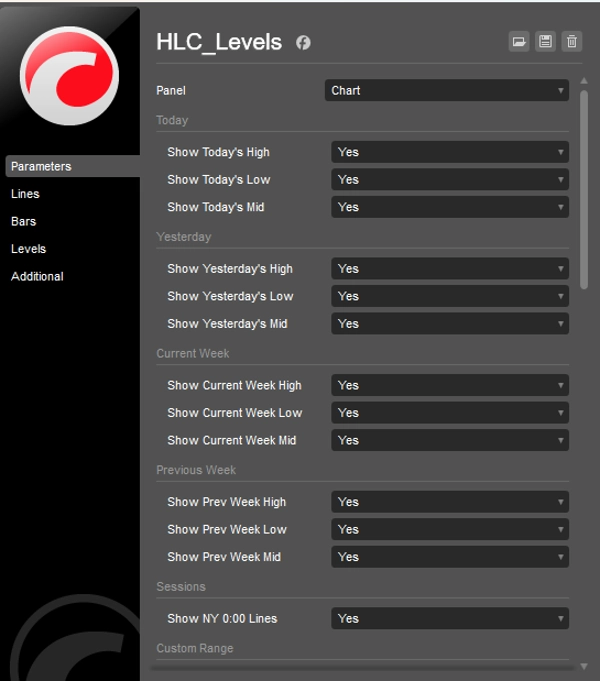
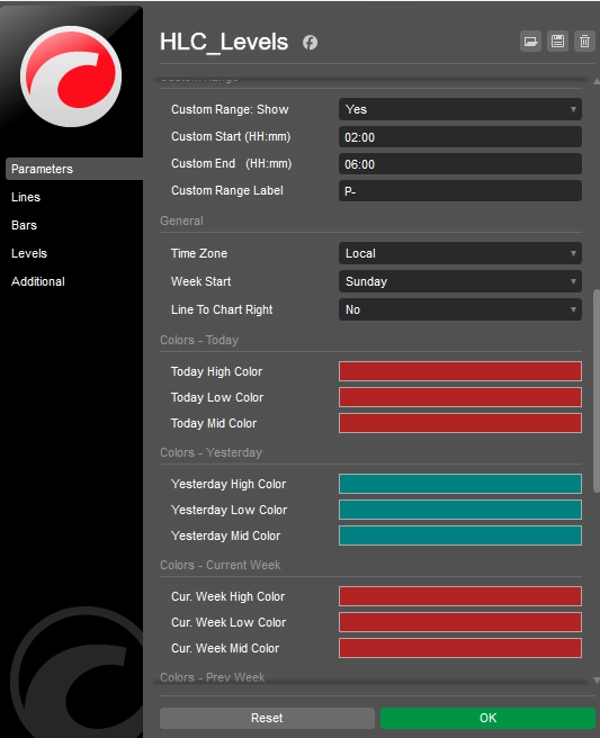
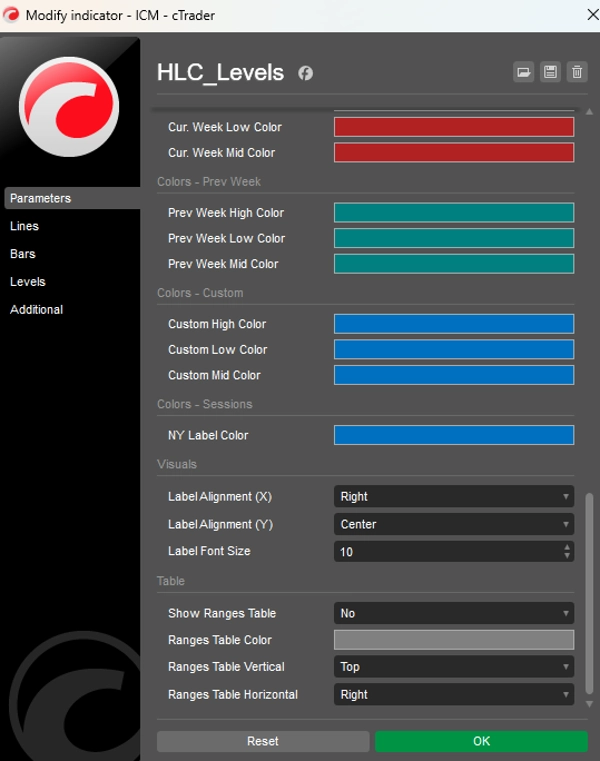
Configurações:
- Ativar/Desativar intervalos de tempo específicos (Hoje, Ontem, Semana, Semana Anterior).
- Horários personalizados de início/fim para intervalos de sessão específicos.
- Opção "Estender Linhas" para projetar níveis para o futuro.
- Cores personalizadas para cada grupo de linhas.
Resumo
Perfil do indicador
Avaliações de clientes
4.3
Avaliações: 3
5 | 33 % | |
4 | 67 % | |
3 | 0 % | |
2 | 0 % | |
1 | 0 % |
Avaliações de clientes
May 16, 2026
Bit weird to see there is no Close level eventhough it's called HLC_levels.. There is a high and low and a mid, but no close. I kinda find it essential to have a close though. Other than that is safes me huge amount of time daily to not set all these levels manually. So besides the lack of the close level i still like this indicator. Would love to see a new version with the added close level as the name suggests
March 2, 2026
A 5 minute check should not become a 30 minute rabbit hole, and the entry needs one more reason to make sense.
February 21, 2026
most of the value comes from the decision gets a little more breathing room. The market context still matters.
Conversa
Perguntas frequentes
Prop
Forex
Scalping
Indices
SMC
AI
XAUUSD
NAS100
USDJPY
Os produtos disponíveis através da cTrader Store, incluindo bots de negociação, indicadores e plugins, são fornecidos por programadores terceiros e são disponibilizados apenas para fins informativos e de acesso técnico. A cTrader Store não é um corretor e não fornece aconselhamento em matéria de investimento, recomendações pessoais ou qualquer garantia de desempenho no futuro.


![Logótipo de "[CB] Pivot Points Pro"](https://cdn.ctrader.com/image/webp/43463c82-67b0-4f10-a4ba-901bba091d81_32594)


Preço
24
Vendas
665
Instalações gratuitas