
Descrição
Dinâmica Avançada de Tendência com Bandas de Bollinger do Oscilador
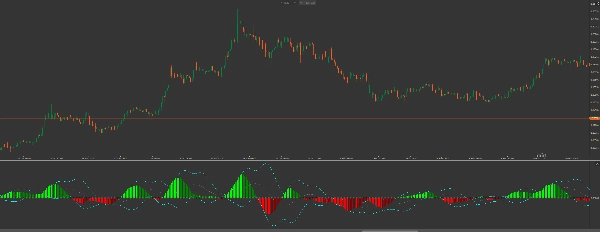
O Squeeze Pro: Momentum & Volatility Suite é um conjunto de ferramentas de nível institucional para cTrader. Diferente dos indicadores padrão, este conjunto oferece uma análise em duas camadas do comportamento do mercado: identifica a Fase de Squeeze (compressão do mercado) e monitora os Extremos de Momentum usando Bandas de Bollinger calculadas diretamente no oscilador.
Inovações Principais
-
- Bandas de Bollinger de Momentum: As primeiras do tipo. Aplicando BBs ao histograma de momentum, você pode identificar níveis de momentum "sobrecomprado" ou "sobrevendido" — perfeito para cronometrar saídas antes que a tendência se esgote.
- Detecção de Squeeze em Três Estados:
-
- Pontos Pretos (Squeeze Ligado): Alta compressão. O mercado está "enrolando" para um grande rompimento.
- Pontos Cinzas (Squeeze Desligado): A volatilidade está se expandindo. O movimento começou.
- Pontos Azuis (Sem Squeeze): Condições normais de mercado.
- Suavização por Regressão Linear: Usa um algoritmo refinado
CalculateLinearRegressionpara filtrar o ruído do preço, fornecendo um histograma suave e confiável. - Lógica de Sobreposição Dupla: Opera em uma janela de indicador separada para manter seu gráfico de preços limpo enquanto oferece insights analíticos profundos.
Guia de Inteligência Visual:
-
- O Histograma (Tendência & Força)
-
- Lima: O momentum de alta está acelerando (Forte Compra).
- Verde: O momentum de alta está desacelerando (Realização de Lucros).
- Vermelho: O momentum de baixa está acelerando (Forte Venda).
- Bordô: O momentum de baixa está desacelerando (Vendedores Esgotados).
- As Bandas do Oscilador (As Linhas "Ciano")
-
- Quando as barras do histograma ultrapassam as Bandas de Bollinger Ciano, a tendência atual está em um extremo estatístico. Procure reversões ou grandes recuos quando o histograma começar a recuar para dentro dessas bandas.
Estratégia de Negociação: O "Power Breakout"
-
- Identifique o Squeeze: Espere os Pontos Pretos aparecerem na linha zero. Isso indica a "calma antes da tempestade."
- Confirme a Direção: Procure a primeira barra do histograma Lima (Compra) ou Vermelha (Venda).
- O Gatilho: Entre na negociação quando o Squeeze Desligado (ponto cinza) aparecer, sinalizando a liberação de energia.
- A Saída: Realize lucros quando o histograma mudar de Lima para Verde, OU quando o histograma atingir a Banda Superior do Oscilador BB, sinalizando exaustão.
Por que Atualizar para o Squeeze Pro?
Enquanto indicadores básicos mostram para onde o preço foi, Squeeze Pro mostra a pressão por trás do movimento. Ao ver o squeeze e as bandas de momentum simultaneamente, você evita entrar em tendências já esgotadas e captura os movimentos explosivos que outros perdem.
Nota do Desenvolvedor: Este indicador é altamente otimizado para a API do cTrader, garantindo zero atraso de desempenho mesmo em máquinas de menor capacidade enquanto lida com cálculos complexos de regressão linear em tempo real.
Resumo
Key features include linear regression smoothing to reduce price noise, a dual-overlay display that keeps the price chart uncluttered, and a color-coded histogram that visually represents bullish and bearish momentum strength and changes. When histogram bars move outside the oscillator’s Bollinger Bands (cyan lines), it signals statistically extreme momentum levels, useful for timing entries and exits.
The indicator supports a "Power Breakout" trading strategy: traders wait for squeeze signals, confirm momentum direction via histogram colors, enter trades on squeeze release, and exit when momentum shows signs of exhaustion. This suite provides institutional-grade insights into trend pressure and momentum dynamics, helping traders identify potential explosive moves and avoid exhausted trends.
Avaliações de clientes
5 | 0 % | |
4 | 100 % | |
3 | 0 % | |
2 | 0 % | |
1 | 0 % |


