MARCs_MARKET_OVERVIEW_PRO
Indikator
Version 1.0, Aug 2026
Windows, Mac
Trading product for MARCs_MARKET_OVERVIEW_PRO Indikator Key Levels RSI, image 2
Trading product for MARCs_MARKET_OVERVIEW_PRO Indikator Key Levels RSI, image 3
Trading product for MARCs_MARKET_OVERVIEW_PRO Indikator Key Levels RSI, image 4
Trading product for MARCs_MARKET_OVERVIEW_PRO Indikator Key Levels RSI, image 5
Trading product for MARCs_MARKET_OVERVIEW_PRO Indikator Key Levels RSI, image 6
Trading product for MARCs_MARKET_OVERVIEW_PRO Indikator Key Levels RSI, image 7
Trading product for MARCs_MARKET_OVERVIEW_PRO Indikator Key Levels RSI, image 8
Trading product for MARCs_MARKET_OVERVIEW_PRO Indikator Key Levels RSI, image 9
Trading product for MARCs_MARKET_OVERVIEW_PRO Indikator Key Levels RSI, image 10
Seit 24/06/2026
1
Kostenlose Installationen

Beschreibung

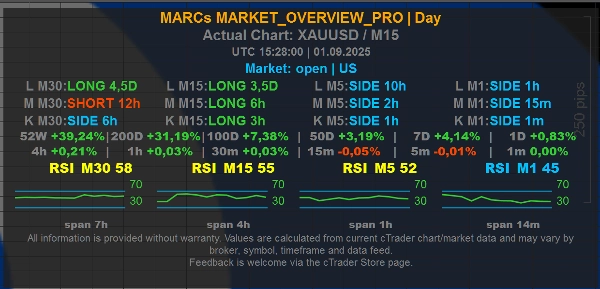
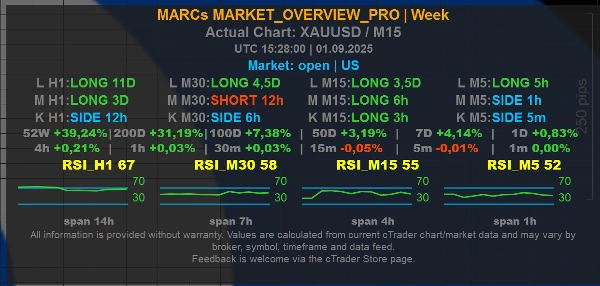
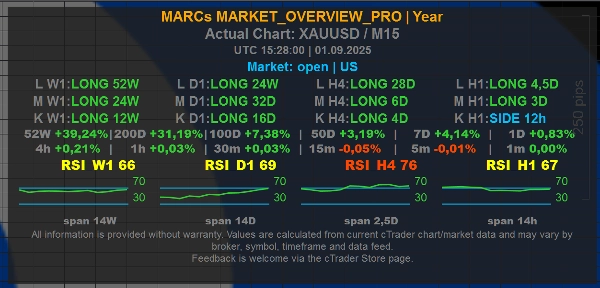
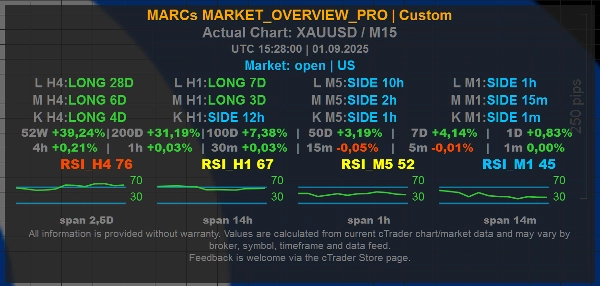
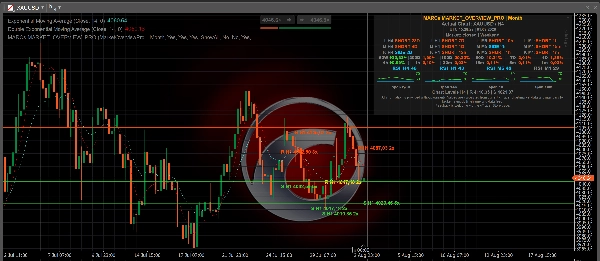
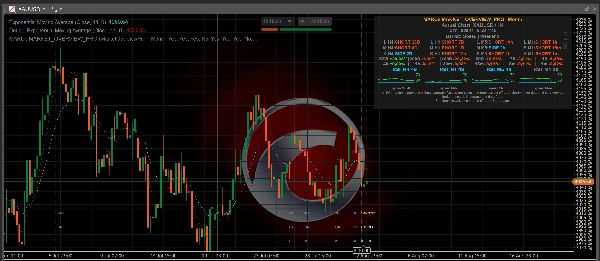
MARCs MARKET_OVERVIEW_Pro ist ein Multi-Timeframe-Marktübersichtsindikator für cTrader.


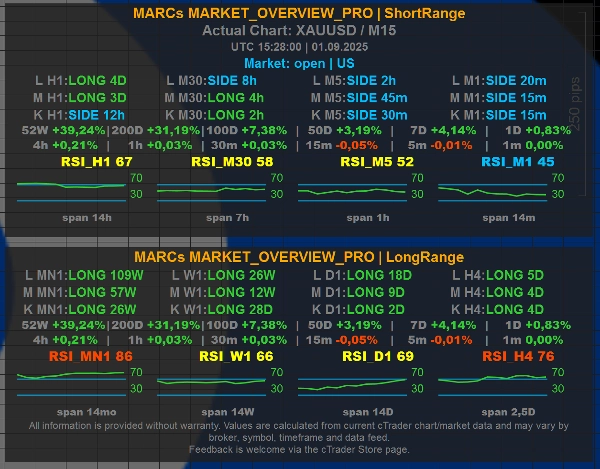
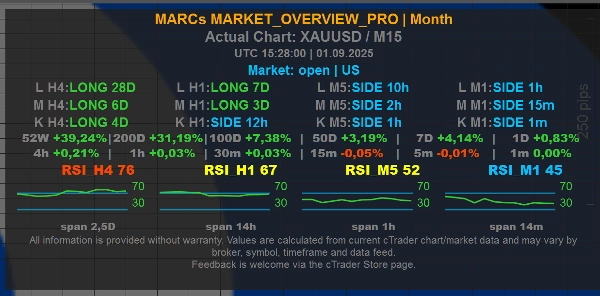
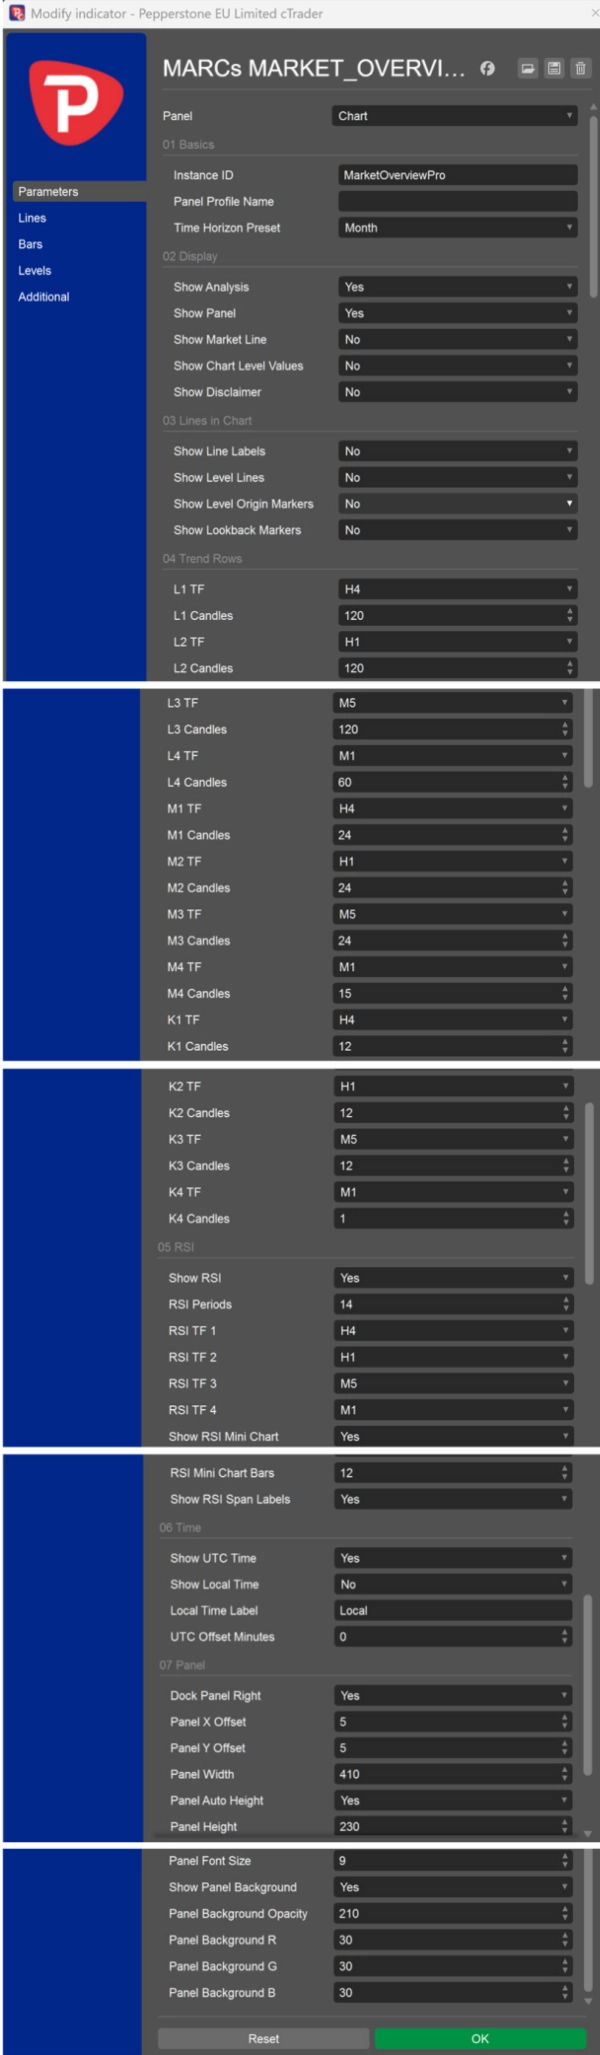
Er zeigt ein kompaktes Dashboard direkt im Chart mit Trendkontext, RSI-Werten, Markt-/Sitzungsinformationen und konfigurierbaren Zeithorizont-Voreinstellungen an. Der Indikator wurde ursprünglich für die Analyse von XAUUSD / Gold entwickelt, ist jedoch als allgemeines Marktübersichtswerkzeug für jedes verfügbare Chartsymbol konzipiert, abhängig von der Datenqualität des Brokers und der verfügbaren Markthistorie.


Hauptmerkmale:

- Multi-Timeframe-Trendreihen für kurzen, mittleren und langen Marktkontext

- Konfigurierbare Voreinstellungen für Tag, Woche, Monat, Jahr, Kurzfrist, Langfrist und Benutzerdefiniert

- RSI-Werte und Mini-RSI-Charts über ausgewählte Zeitrahmen

- Optionale Anzeige von UTC- und Ortszeit

- Optionale Markt-/Sitzungslinie

- Optionale Referenzlinien auf Chart-Ebene

- Optionale Chart-Ebenenwerte, die direkt im Panel angezeigt werden


Level-Linien und Chart-Ebenenwerte:

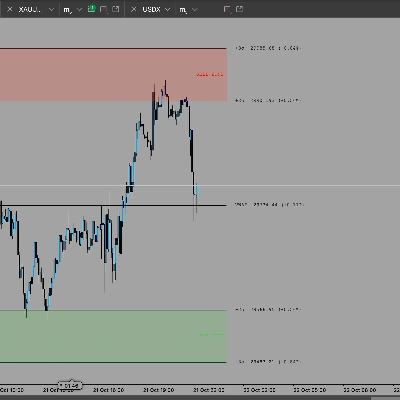
Die optionale Einstellung "Show Level Lines" kann berechnete Chart-Referenzlevel aus einem ausgewählten Zeitrahmen anzeigen: M1, M5, M15, M30, H1, H4, D1, W1 oder MN1. Für diese einzelnen Zeitrahmen-Auswahlen zeigt der Indikator den nächstgelegenen berechneten Widerstand oberhalb des aktuellen Preises und die nächstgelegene berechnete Unterstützung unterhalb des aktuellen Preises an. "ShowAll" zeigt das breitere H1-Level-Set aus der bestehenden H1-Level-Berechnung. "No" hält die Level-Linien verborgen.


Die optionale Einstellung "Show Chart Level Values" kann dieselben nächstgelegenen Widerstands-/Unterstützungsreferenzwerte direkt im Panel anzeigen, ohne Linien im Chart zu zeichnen. Die Panel-Linie ist beispielsweise mit "Chart Levels H1 | R ... | S ..." beschriftet, um klarzustellen, dass sich die Werte auf Chart-Ebenenreferenzen beziehen.


Wie Level-Linien berechnet werden:

Die Level werden aus vergangenen Swing-Hochs und Swing-Tiefs im ausgewählten Zeitrahmen abgeleitet. Nahegelegene Swing-Punkte werden zu Level-Clustern gruppiert, und nur Bereiche mit genügend wiederholten Berührungen werden angezeigt. Dies macht die Linien zu visuellen Markt-Kontextmarkern basierend auf der verfügbaren Chart-Historie.


Wichtig:

MARCs Market Overview Pro ist ein reines Analyse-Tool zur Marktübersicht. Es führt keine Trades aus, verwaltet keine Positionen, gibt keine Anlageberatung und garantiert keine Handelsergebnisse.


Level-Linien sind keine Kaufsignale, Verkaufssignale, Stop-Loss-Empfehlungen, Take-Profit-Empfehlungen oder Anlageberatung. Sie sagen nicht voraus, dass der Preis an einem bestimmten Level umkehrt, ausbricht oder reagiert.


Alle Werte hängen von den verfügbaren cTrader-Chartdaten, dem Broker-Symbolfeed, dem Zeitrahmen und der Markthistorie ab. Werte können zwischen Brokern, Symbolen und Datenfeeds variieren.


Trading beinhaltet Risiken. Vergangene Leistungen garantieren keine zukünftigen Ergebnisse.

Zusammenfassung

KI-Zusammenfassung
MARCs MARKET_OVERVIEW_Pro is a multi-timeframe market overview indicator designed for the cTrader platform. It provides a compact on-chart dashboard that displays trend context across short, medium, and long timeframes, RSI values with mini RSI charts, and market/session information. Users can configure time-horizon presets including Day, Week, Month, Year, ShortRange, LongRange, and Custom settings.
The indicator supports optional display of UTC and local times, market/session lines, and chart-level reference lines. These reference lines represent calculated support and resistance levels derived from clusters of past swing highs and lows on selected timeframes ranging from 1 minute to monthly intervals. Users can choose to show these levels as lines on the chart or as numeric values within the dashboard panel.
Originally developed with a focus on XAUUSD (Gold), MARCs MARKET_OVERVIEW_Pro is adaptable to any chart symbol supported by the broker’s data feed and market history. It serves as an analysis tool providing visual market structure and momentum insights but does not execute trades or offer trading advice. The indicator’s readings depend on the quality and availability of broker data and chart history.
Indikatorprofil
Indikatorkategorie
Marktstruktur (SMC)
Ausgabetyp
Visualisierung
Filter
Datenanforderungen
Nur Balken
Unterstützte Signale
Trendstärke
Level – Berührung

Kundenbewertungen

0.0
Bewertungen: 0
Kundenbewertungen
Bisher gibt es keine Bewertungen für dieses Produkt. Haben Sie es schon ausprobiert? Dann können Sie die erste Person sein, die andere darüber informiert!

Diskussion

Häufig gestellte Fragen (FAQ)

Key Levels
RSI
Market Structure
Risk Dashboard
Support & Resistance
Über den cTrader Store verfügbare Produkte, einschließlich Handelsbots, Indikatoren und Plugins, werden von externen Entwicklern bereitgestellt und nur zu Informations- und technischen Zugriffszwecken verfügbar gemacht. cTrader Store ist kein Broker und erbringt keine Anlageberatung, persönlichen Empfehlungen oder eine Garantie für zukünftige Performance.

Mehr von diesem Autor

Indikator
RSI
Key Levels
+3
MARKs Free XAUUSD market overview dashboard with trend rows, RSI context, sessions and fixed Day/Month presets.
cBot
Conservative
Fixed Risk %
+5
MARCs GOLD H4-Gold-Swing-Bot for XAUUSD with transparent long-term backtests and optional reserve/guard system.
3.01
Gewinnfaktor

Das könnte Sie auch noch interessieren

Indikator
SMC
Forex
+13
MultiFrameCandles para cTrader: La Herramienta Definitiva para Dominar Cualquier Marco de Tiempo
Indikator
BOS
EMA
+5
Directional volume heatmap: see if a price zone was built on buying or selling, not just how much.
Indikator
Drawdown Monitor
Proprietary trading desk risk monitoring dashboard!
Indikator
AI
ATR
+9
Index Hunter: Momentum analysis for US30 & NAS100. Designed to identify high-velocity moves and intraday trends.
Indikator
This indicator is a valuable tool for traders looking to identify significant opening price level of any asset.
Indikator
VWAP
Forex
+13
Custom VWAP Indicator for cTrader
Indikator
Customizable window inside your platform, access to any website Calendar
Indikator
Key Levels
Order Block
+2
It monitors trend lines on price charts and fires multi-channel alerts and optionally places trades when price crosses..
Indikator
Laser entries with pivot confirmation. No repaint, all timeframes. Professional results.
Indikator
Overlay HTF context on any chart: color bars by HTF and draw filled HTF bodies with optional High/Low lines.
Indikator
Forex
Crypto
+3
Day of Week Indicator for cTrader
Indikator
AI
ATR
+26
SMC without the mess: Clean structure + auto-managing FVGs + MTF panel. Hard-right-edge, step size-based for any symbol.
Indikator
Forex
Signal
+4
Gann Pivot Vision is an innovative analytical tool that combines classic pivot reversal levels and Gann geometry
Indikator
BOS
CHOCH
+5
A professional-grade cTrader indicator for traders following the Inner Circle Trader (ICT) methodology. It replaces 6–8
Indikator
Forex
EURUSD
+5
Fimathe Indicator - Fimathe PCM - Automated Trend Channels & Levels — Ideal for live trading and backteting
Indikator
Prop
Forex
+12
⚡ ADXVMA Aurora Trend Filter combines ADX trend strength with an adaptive EMA blend ⚡
Indikator
ATR
Breakout
Detects swing highs/lows, structure, breakouts, trend lines, and fibs — great for price action trading.
Indikator
Prop
Forex
+4
Draws pivots (P, S/R, CPR) from selected anchors like H1–Month1, with optional mid-levels (PS1, S1S2, etc.)

Preis

Seit 24/06/2026
1
Kostenlose Installationen