OR Session Zones
Chỉ báo
Phiên bản 1.1, Dec 2025
Windows, Mac
4.5
Đánh giá: 2
Mô tả
Vùng Phiên OR — Chỉ Báo Phạm Vi Mở Phiên Đa Phiên
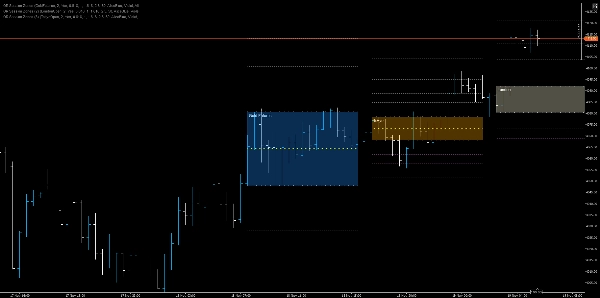
Một chỉ báo Phạm Vi Mở chính xác cao phát hiện các phiên mở cửa (NY, London, EU, Tokyo, Thượng Hải, hợp đồng tương lai Vàng/Dầu thô), vẽ các vùng OR cao/thấp/giữa động, dự báo các mục tiêu dựa trên Fibonacci, và tô một khu vực bóng có thể cấu hình để quyết định nhanh chóng bằng mắt.
Các tính năng chính
- Phát hiện đa phiên: Hỗ trợ gốc cho các thanh mở cửa của New York, London, EuroNext, Tokyo, Thượng Hải, Hợp đồng tương lai Vàng và Hợp đồng tương lai Dầu thô sử dụng các chỉ báo phiên chuyên dụng.
- Tính toán Phạm Vi Mở: Tính OR Cao và OR Thấp từ số lượng nến có thể cấu hình (RangeCandles) và ghi lại thời gian bắt đầu phiên.
- Lớp phủ biểu đồ bền vững: Vẽ các đường xu hướng cho OR Cao, OR Thấp và OR Giữa (50%) trên toàn bộ biểu đồ cho đến thời gian mở rộng có thể cấu hình.
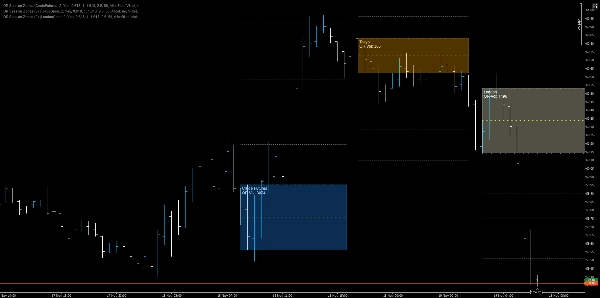
- Vùng bóng: Hình chữ nhật được tô giữa OR Cao và OR Thấp với độ mờ và màu sắc có thể cấu hình cho mỗi phiên để cung cấp ngữ cảnh trực quan ngay lập tức.
- Dự báo Fibonacci: Lên đến bốn đường dự báo R (kháng cự) và S (hỗ trợ) được tạo ra từ phạm vi OR với màu sắc độc lập và độ mờ điều chỉnh được.
- Khả năng hiển thị linh hoạt: Tùy chọn ẩn hoặc hiển thị các ID đối tượng được đánh chỉ số (duy nhất) để tránh xung đột; hỗ trợ cả đối tượng bền vững đơn lẻ và đối tượng theo từng thanh khi bật/tắt Hide.
- Mã màu phiên: Mỗi phiên sử dụng một bảng màu riêng biệt (ví dụ, DodgerBlue, LightYellow, Orange, OrangeRed) để làm cho nguồn gốc phiên dễ nhận biết ngay lập tức.
Cách nó giúp các nhà giao dịch
- Ngữ cảnh nhanh: Nhìn ngay lập tức thấy thị trường mở cửa ở đâu cho một phiên lớn và hiểu cấu trúc phạm vi ban đầu mà không cần đo thủ công.
- Kích hoạt quyết định: Sử dụng các đột phá OR, từ chối đường giữa, và dự báo Fibonacci làm quy tắc vào/ra hoặc điểm neo đặt dừng.
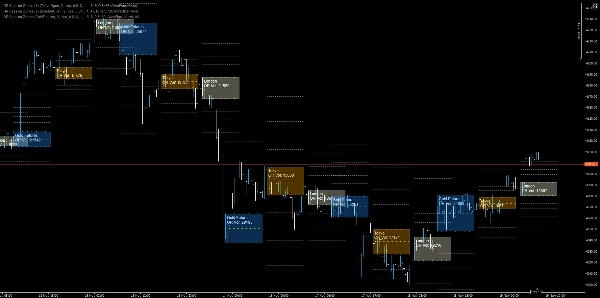
- Chiến lược đa phiên: Kết hợp các OR chồng lấn (ví dụ, London + NY) để phát hiện các vùng hội tụ phiên và các khu vực giao dịch có xác suất cao hơn.
- Quản lý rủi ro: Đặt điểm dừng phía sau các chồng OR hoặc sử dụng mức giữa 50% làm mục tiêu dừng/lấy lời động.
Các kịch bản sử dụng và quy tắc ví dụ
- Vào lệnh phá vỡ: Mua khi đóng cửa trên OR Cao với xác nhận từ khối lượng hoặc động lượng; đặt dừng ngay dưới OR Cao (hoặc OR Giữa để thoát chặt hơn).
- Phản ứng mở cửa: Bán khống gần OR Cao với xác nhận đảo chiều nếu giá không duy trì trên OR Giữa và thể hiện sự rút nhanh các lệnh đặt mua.
- Giao dịch hội tụ phiên: Khi các OR của London và NY chồng lên nhau, coi vùng chồng lấn như một vùng cung/cầu có độ tin cậy cao và điều chỉnh kích thước vị thế tương ứng.
- Mục tiêu dự báo: Sử dụng R1/R2/R3/R4 làm các mức chốt lời phân tầng và S1 - S4 đối xứng cho các mục tiêu giảm giá.
Tóm tắt
Hồ sơ chỉ báo
Đánh giá của khách hàng
4.5
Đánh giá: 2
5 | 50 % | |
4 | 50 % | |
3 | 0 % | |
2 | 0 % | |
1 | 0 % |
Đánh giá của khách hàng
November 22, 2025
Solid enough as a backup opinion, and It can look better than it is during a lucky run.
November 19, 2025
Thảo luận
Câu hỏi thường gặp
Fibonacci
Forex
Breakout
Indices
EURUSD
Commodities
GBPUSD
XAUUSD
NAS100
Các sản phẩm có sẵn trên cTrader Store, bao gồm bot giao dịch, chỉ báo và plugin, được cung cấp bởi các nhà phát triển bên thứ ba và chỉ nhằm mục đích cung cấp thông tin và tiếp cận kỹ thuật. cTrader Store không phải là nhà môi giới và không cung cấp lời khuyên đầu tư, khuyến nghị cá nhân hay bất kỳ đảm bảo nào về hiệu suất trong tương lai.


Giá
26
Lượt bán
2.15K
Cài đặt miễn phí