
Mô tả
🟢 Chỉ báo Heiken Ashi Mượt mà cho cTrader
Giao dịch rõ ràng. Theo xu hướng với sự tự tin.
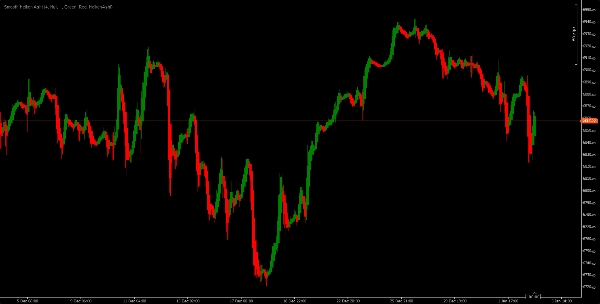
Chỉ báo Heiken Ashi Mượt mà là một công cụ biểu đồ tinh chỉnh được thiết kế để lọc bỏ nhiễu thị trường và làm nổi bật động lượng giá thực sự. Được xây dựng cho nền tảng cTrader, chỉ báo này kết hợp nến Heiken Ashi truyền thống với thuật toán làm mượt để cung cấp các tín hiệu xu hướng sạch hơn, đáng tin cậy hơn.
🔍 Tính Năng Chính
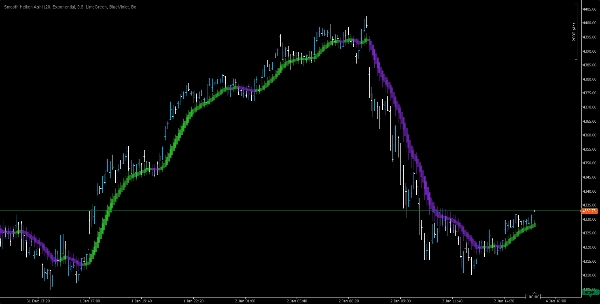
• Nến Heiken Ashi Được Làm Mượt
Giảm các tín hiệu sai và biến động giá lộn xộn với các cây nến được cải thiện về mặt hình ảnh nhấn mạnh hướng xu hướng.
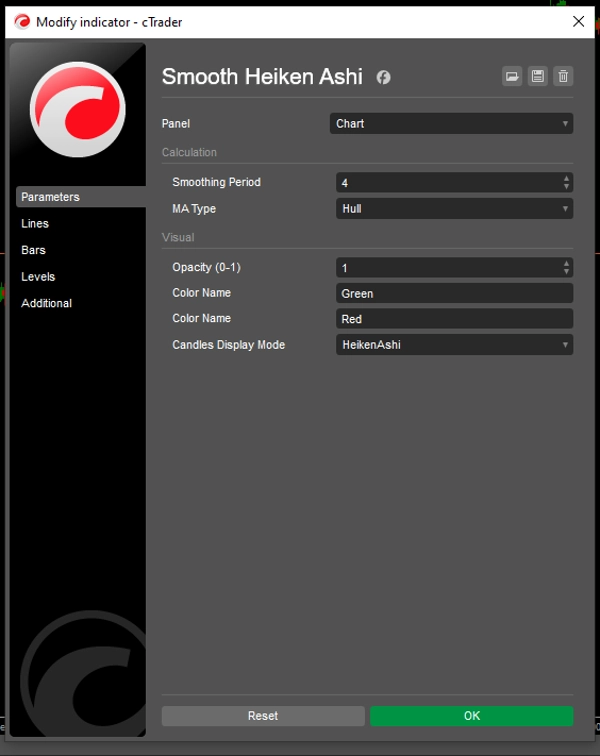
• Tùy Chỉnh Tùy Chọn Làm Mượt
Điều chỉnh yếu tố làm mượt để phù hợp với phong cách giao dịch của bạn—dù bạn đang giao dịch lướt sóng hay giao dịch theo xu hướng.
• Đường Chồng Lên Xu Hướng
Một đường cong động chồng lên các cây nến để củng cố sức mạnh xu hướng và khả năng đảo chiều.
• Hình Ảnh Sạch Sẽ
Các sắc thái màu tinh tế và thiết kế tối giản giúp biểu đồ của bạn dễ đọc và dễ hiểu hơn.
📈 Phù Hợp Cho
• Chiến lược theo xu hướng
• Xác nhận động lượng
• Lọc nhiễu thị trường
• Nhà giao dịch trực quan tìm kiếm sự rõ ràng và chính xác
Heiken Ashi Mượt Mà giúp bạn tập trung vào những gì quan trọng—hướng giá, không phải những phiền nhiễu. Dù bạn đang xây dựng hệ thống thuật toán hay giao dịch thủ công, chỉ báo này thêm một lớp tự tin cho phân tích của bạn.
Tóm tắt
Đánh giá của khách hàng
5 | 100 % | |
4 | 0 % | |
3 | 0 % | |
2 | 0 % | |
1 | 0 % |


