
Описание
индикатор который окрашивает свечи в реальном времени на основе рыночной структуры и рисует зоны ликвидности, институциональные потоки и диапазоны консолидации. Разработан для трейдеров, работающих по принципам Smart Money Concepts (SMC).
🧠 Логика алгоритма
https://chartshots.spotware.com/c/69f0e3fd81319
1. Обнаружение рыночной структуры 🔍
- Находит поворотные точки (локальные максимумы и минимумы) с использованием настраиваемого периода обратного просмотра.
- Сравнивает последовательные поворотные точки для определения структуры:
-
- Высшие максимумы + высшие минимумы = Бычий уклон 📈
- Нижние максимумы + нижние минимумы = Медвежий уклон 📉
- Смешанные сигналы = Нейтральный уклон ➡️
- Фильтрует шум: учитывает только поворотные точки, которые выходят за порог, основанный на ATR (средний истинный диапазон), умноженном на регулируемую чувствительность.
https://chartshots.spotware.com/c/69f0e7e752b74
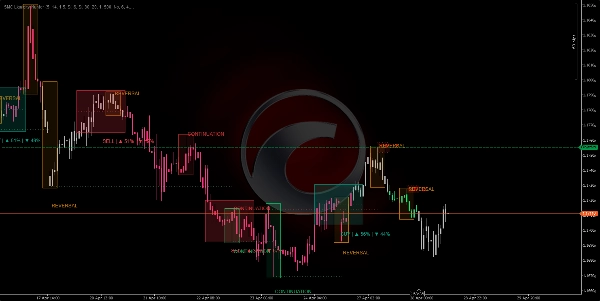
2. Институциональные потоки (Flow Boxes) 🔄
- Каждый раз, когда формируется новая значимая поворотная точка, алгоритм рисует горизонтальную линию от предыдущей поворотной точки до новой.
- Классифицирует поток как:
-
- Продолжение: цена следует тренду (HL при восходящем тренде, LH при нисходящем) ✅
- Разворот: цена ломает структуру (LL при восходящем тренде, HH при нисходящем) ⚠️
- Рисует цветной прямоугольник вокруг поворотной точки с надписью "CONTINUATION" или "REVERSAL".
3. Зоны спроса/предложения (ликвидность) 💧
https://chartshots.spotware.com/c/69f0e8e7aef29
- Вокруг каждой значимой поворотной точки рисуется горизонтальная полоса , простирающаяся в будущее на настраиваемое количество баров.
- Эти зоны представляют собой неисполненные институциональные ордера:
-
- Медвежьи поворотные точки → зона SUPPLY (ордеры на продажу) 🔴
- Бычьи поворотные точки → зона DEMAND (ордеры на покупку) 🟢
- Зона ломается и исчезает когда цена проникает в неё с достаточной силой или когда срок её жизни истекает.
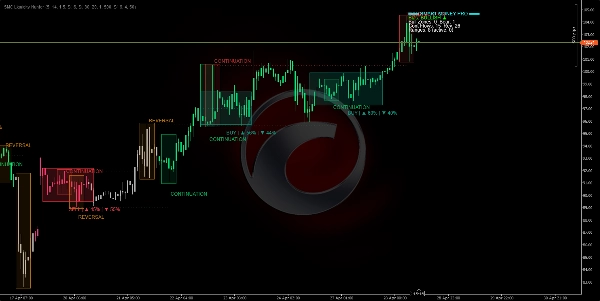
4. Движок обнаружения диапазонов (консолидаций) 📦
- Вычисляет простую скользящую среднюю (SMA) с полосой ATR вокруг неё.
- Если каждый отдельный бар в пределах окна обратного просмотра остаётся внутри полосы, алгоритм определяет диапазон консолидации.
- Рисует синий прямоугольник с:
-
- Пунктирной средней линией (равновесие диапазона) ⚖️
- Процентом вероятности пробоя бычьего/медвежьего на основе:
-
- Направленного импульса (ADX/DI+ против DI-) 📐
- Накопленного объёма быков против медведей внутри диапазона 📊
- Времени, проведённого в верхней против нижней половине ⏱️
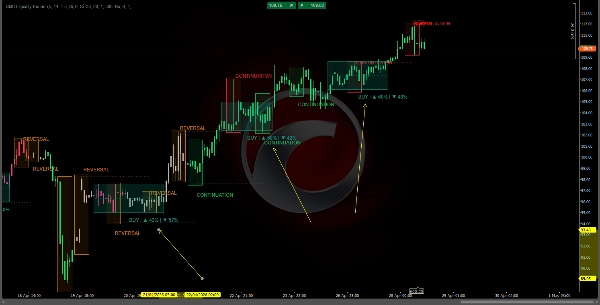
5. Окраска свечей (чисто и визуально) 🕯️
- Зелёная свеча = подтверждённая бычья структура (HH+HL) 🟢
- Магента/красная свеча = подтверждённая медвежья структура (LH+LL) 🔴
- Серая свеча = нейтральная или переходная фаза ⚪
- Отсутствие перекрывающихся прямоугольников: реальные тени и тела свечей всегда полностью видны.
📋 Панель управления (угол)
Числовое резюме активных зон, потоков и диапазонов
🛠️ Как использовать
⚙️ Рекомендуемые настройки
- Таймфрейм: H1 или выше (идеально для Smart Money).
- Параметры по умолчанию: хорошо подходят для Forex, индексов и криптовалют.
- Настройка чувствительности: увеличьте для волатильных рынков, уменьшите для боковых рынков с флетом.
📗 Правила торговли :
✅ Вход в лонг (ПОКУПКА)
- Свечи должны быть зелёными (активен бычий уклон) 🟢
- Цена касается или приближается к активной зоне "DEMAND" 🟢
- В этой зоне появляется коробка "CONTINUATION" (не "REVERSAL") ✅
- Панель управления показывает вероятность бычьего пробоя > 60% на активном диапазоне (если есть) 📊
✅ Вход в шорт (ПРОДАЖА)
- Свечи должны быть магентовыми/красными (активен медвежий уклон) 🔴
- Цена касается или приближается к активной зоне "SUPPLY" 🔴
- В этой зоне появляется коробка "CONTINUATION" (не "REVERSAL") ✅
- Панель управления показывает вероятность медвежьего пробоя > 60% 📊
❌ НЕ торгуйте, если...
- Свечи серые (нет определённого уклона) ⚪
- Появляется сигнал "REVERSAL" именно там, где вы собирались войти ⚠️
- Цена находится внутри синего диапазона без явного пробоя 🔵
- Панель управления показывает противоположное совпадение (медвежье совпадение при бычьей настройке или наоборот) 🔄
📈 Интерпретация панели управления
text
═══ SMART MONEY PRO ═══
Уклон: БЫЧИЙ ▲ ← Текущий рыночный уклон
Бычьи зоны: 2 Медвежьи: 1 ← Активные зоны ликвидности
Потоки продолжения: 3 Развороты: 0 ← Продолжения против разворотов
Диапазоны: 4 (активный: 1) ← Всего и активных диапазонов
Активный диапазон ▲65% ▼35% ← Вероятность пробоя
⚡ БЫЧЬЕ СОВПАДЕНИЕ ← Максимальный сигнал выравнивания
💡 Ключевые принципы
- ✅ Без перерисовки: всё рассчитывается только по закрытым барам.
- ✅ Чистый график: цветные реальные свечи, полупрозрачные зоны, отсутствие визуального шума.
- ✅ Предварительный просмотр структуры: цвет свечи показывает фазу рынка до того, как поворотные точки становятся очевидными.
- ✅ Встроенное совпадение: когда активная зона + активный диапазон + сигнал потока совпадают, панель управления явно сигнализирует об этом.
Сводка
Key features include:
- **Institutional Flows:** Draws horizontal lines and colored boxes between significant pivots, labeling flows as "CONTINUATION" or "REVERSAL" to indicate trend respect or break.
- **Supply and Demand Zones:** Highlights unexecuted institutional orders with horizontal bands around pivots, distinguishing supply (sell) and demand (buy) zones that expire or break upon price penetration.
- **Range Detection:** Identifies consolidation ranges using an SMA with ATR bands, marking them with blue rectangles and providing breakout probability percentages based on momentum, volume, and time distribution.
- **Dashboard:** Displays numeric summaries of active zones, flows, ranges, and breakout probabilities, including confluence signals when multiple factors align.
Recommended for use on H1 or higher timeframes, the indicator suits Forex, indices, and cryptocurrencies. It operates without repainting by relying on closed bar data and maintains a clean chart presentation with visible candle wicks and bodies.
Отзывы покупателей
5 | 50 % | |
4 | 0 % | |
3 | 0 % | |
2 | 50 % | |
1 | 0 % |


![Логотип продукта "[Stellar Strategies] Inside Bar with Signals"](https://cdn.ctrader.com/image/webp/1d9e8bfa-3b2c-4440-bb37-5856902008a7_30683)


![Логотип продукта "[Hamster-Coder] Pivot Points MTF"](https://cdn.ctrader.com/image/webp/4c143e5a-309c-40e3-a578-f04d1e133ffa_31159)