
Описание
Индикаторы Pinescriptlabs Store: Pinescriptlabs Store cBots : (cBot) Gold & BTC BreakoutSession Pivots(новый)
Проекция ликвидности цены ZigZag
Умный алгоритм трейлинга (новый)
Прогноз на основе Linreg & ATR
SmartTrend Поддержка и
Сопротивление
Линии
Сессии разрыва справедливой стоимости
Динамический
Анализ рыночной структуры
Поворотных
Точек
Points
Фибоначчи
Линейная
Регрессия
Мульти-таймфрейм
Импульсный разрыв справедливой стоимости
Многоуровневый
Трекер свечного смещения
Tracker
Авто
Линии поддержки и
сопротивления
тренда
Lines
Все
уровни поддержки и
сопротивления
Levels
Динамический импульс диапазона
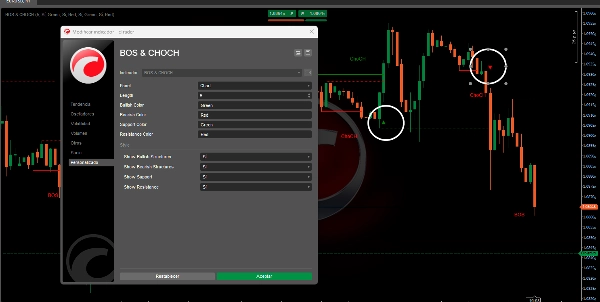
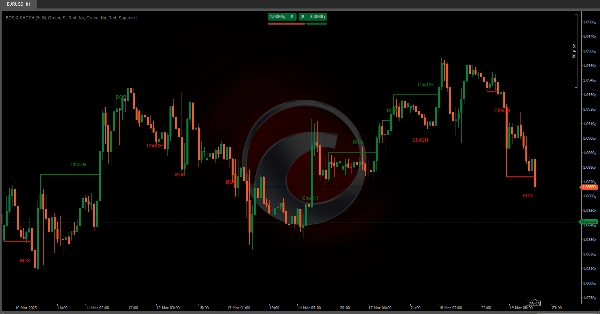
Алгоритм предназначен для выявления структурных рыночных паттернов , в частности концепций Изменения характера (ChoCH) 🔄 и Прорыва структуры (BoS) 💥. Ниже я подробно объясню, что делает этот алгоритм, его назначение и как он идентифицирует эти две концепции.
Что делает алгоритм?
Алгоритм использует фракталы (локальные максимумы и минимумы), чтобы определить, изменилось ли поведение цены или был нарушен ранее установленный структурный уровень. Ниже приведены основные функции:
Обнаружение фракталов 📊
- Бычий фрактал возникает, когда есть локальный максимум, при котором свечи с обеих сторон ниже. 📈
- Медвежий фрактал возникает, когда есть локальный минимум, при котором свечи с обеих сторон выше. 📉
- Эти фракталы служат опорными точками для определения изменений в рыночной структуре.
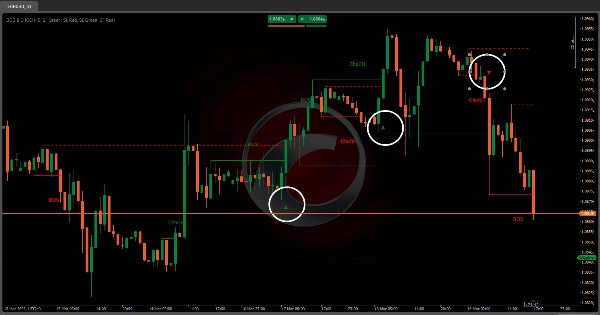
Идентификация ChoCH (Изменение характера) 🔄
- Бычий ChoCH происходит, когда цена превышает бычий фрактал без предварительного формирования полной медвежьей структуры.
- Медвежий ChoCH происходит, когда цена опускается ниже медвежьего фрактала без предварительного формирования полной бычьей структуры.
- Это указывает на то, что рынок изменил свой характер (с тренда на консолидацию или наоборот).
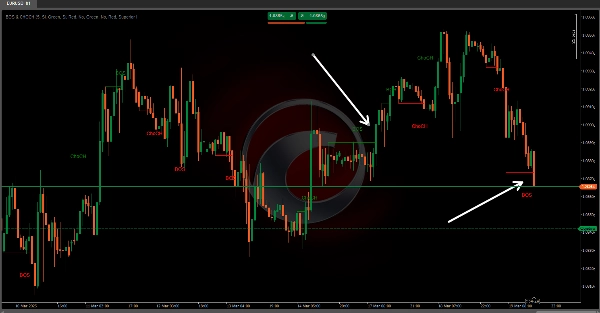
Идентификация BoS (Прорыв структуры) 💥
- Бычий BoS происходит, когда цена превышает бычий фрактал после формирования полной медвежьей структуры.
- Медвежий BoS происходит, когда цена опускается ниже медвежьего фрактала после формирования полной бычьей структуры.
- Это указывает на то, что рынок нарушил ранее установленную структуру, что может быть важной точкой входа или выхода.
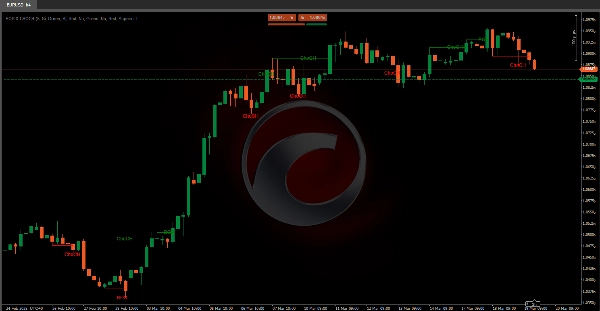
Визуализация поддержки и сопротивления 🛡️
- Алгоритм может рисовать линии поддержки и сопротивления на основе обнаруженных фракталов.
- Он также проверяет, нарушены ли эти линии, отмечая точки прорыва визуальными иконками.
Этот алгоритм предоставляет трейдерам ценные сведения о поведении рынка, четко идентифицируя ключевые структурные изменения и потенциальные возможности прорыва. Используя ChoCH 🔄 и BoS 💥 сигналы, трейдеры могут принимать более обоснованные решения о входах, выходах и общей динамике рынка.
Сводка
Key functionalities include:
- **Fractal Detection:** Identifies bullish fractals (local highs with lower candles on both sides) and bearish fractals (local lows with higher candles on both sides).
- **Change of Character (ChoCH):** Signals when the market changes its behavior, such as shifting from trend to consolidation, by surpassing fractals without forming a complete opposite structure.
- **Break of Structure (BoS):** Indicates when the market breaks a previously established structure, marking potential entry or exit points.
- **Support and Resistance Visualization:** Draws support and resistance lines based on fractals and marks breakout points with visual icons.
This indicator aids traders in understanding market dynamics by clearly highlighting structural changes and breakout opportunities, supporting more informed trading decisions.
Отзывы покупателей
5 | 100 % | |
4 | 0 % | |
3 | 0 % | |
2 | 0 % | |
1 | 0 % |


