
Описание
Индикаторы Pinescriptlabs Store: Pinescriptlabs Store cBots : (cBot) Gold & BTC BreakoutSession Pivots(new)
PRICE ACTION (New)
Prediction Based on Linreg & ATR
SmartTrend Support &
Resistance
Lines
Dynamic
Market Structure
Analysis
of
Turning
Points
Fibonacci
Linear
Regression
Multi-timeframe
Multi-Level
Candle Bias
Tracker
Auto
Support and
Resistance
Trend
Lines
All
Support and
Resistance
Levels
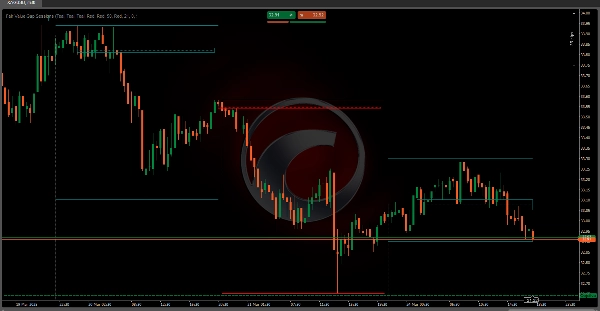
Сессии Fair Value Gap 📊💰
Индикатор Fair Value Gap (FVG) — это сложный торговый инструмент, предназначенный для выявления и выделения временных рыночных неэффективностей, известных как «пробелы справедливой стоимости» 🚨 в рамках конкретных торговых сессий. Эти пробелы представляют собой моменты, когда рыночная цена быстро движется ⚡, создавая дисбаланс между покупателями и продавцами.
Ключевые технические механизмы 🔧
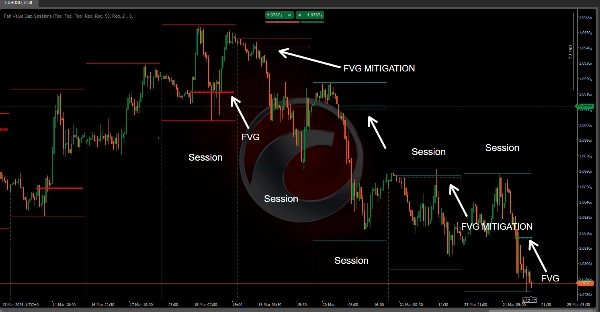
Архитектура на основе сессий 🕒
• Реализует точный, настраиваемый подход к анализу на основе сессий
• Позволяет трейдерам задавать пользовательское время начала сессии с поддержкой UTC или локального часового пояса 🌍
• Создает динамическую границу сессии, которая сбрасывается и отслеживает поведение рынка 🔄
Логика обнаружения Fair Value Gap 🔎
• Использует продвинутый анализ ценового действия на нескольких последовательных барах
• Выявляет пробелы путем сравнения:
o Максимумов и минимумов последовательных баров 📈📉
o Цены закрытия предыдущего бара ✅
o Структуры цены текущего бара 🔄
Классификация пробелов 🏷️
Индикатор различает два основных типа пробелов:
- Бычий Fair Value Gap 📈
o Возникает, когда цена прыгает выше предыдущего максимума 🔺
o Указывает на потенциальный восходящий импульс рынка 🚀
o Сигнализирует о возможном давлении покупателей 💸 - Медвежий Fair Value Gap 📉
o Возникает, когда цена падает ниже предыдущего минимума 🔻
o Предполагает потенциальный нисходящий импульс рынка ⬇️
o Сигнализирует о возможном давлении продавцов 🛑
Применение в торговле 📱💼
Стратегические инсайты 💡
• Помогает трейдерам визуализировать рыночные неэффективности 🖼️
• Обеспечивает раннее предупреждение о возможных разворотах тренда ⚠️
• Предлагает точное определение точек входа и выхода 🎯
Функции управления рисками 🛡️
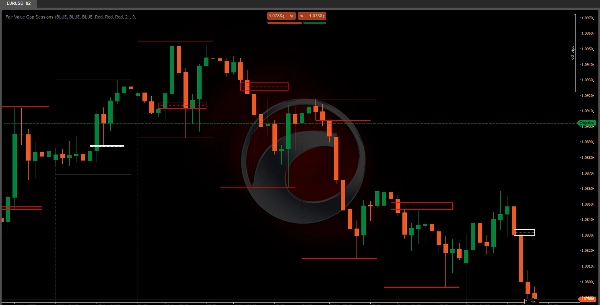
• Визуализация состояний пробелов с цветовой кодировкой 🎨
• Отслеживает «смягчение» пробела (когда цена возвращается в зону пробела) ↔️
• Позволяет настраивать цвета для разных рыночных условий 🎨
Техническая визуализация 🎨
Индикатор создает два основных визуальных элемента:
- Прямоугольник зоны пробела 🟩
o Представляет ценовой диапазон выявленного пробела 📐
o Динамически расширяется в течение торговой сессии ➡️
o Меняет цвет в зависимости от состояния пробела (активен/смягчен) 🟩➡️🟨 - Линия уровня 📏
o Расположена в середине пробела ⚫
o Помогает трейдерам быстро определить центральную ценовую зону пробела 📍
o Использует разные стили линий для обозначения состояния пробела ➔
Практические торговые стратегии 📝
Стратегии сигналов входа 🚦
• Используйте обнаружение пробелов как потенциальный сигнал продолжения тренда 🔄
• Ищите возвращение цены к пробелу (смягчение) в качестве подтверждения ✅
• Сочетайте с другими техническими индикаторами для надежного принятия решений 🤝
Методы управления рисками 🛡️
• Устанавливайте стоп-лосс рядом с границами пробела ⛔
• Используйте середину пробела как потенциальный уровень поддержки/сопротивления 🪜
• Отслеживайте смягчение пробела как индикатор возможного разворота тренда ↔️⚠️
Гибкость настройки ⚙️
• Настраиваемое время начала сессии ⏰
• Конфигурация часового пояса (UTC/локальный) 🌍
Понимая и правильно применяя индикатор Fair Value Gap Sessions, трейдеры могут получить более глубокое понимание динамики рынка, выявлять потенциальные торговые возможности и принимать более обоснованные решения на основе неэффективностей ценового действия. 🧠📈
Сводка
It classifies gaps into two types: bullish gaps, indicating potential upward momentum and buying pressure, and bearish gaps, signaling possible downward momentum and selling pressure. Visually, it represents gaps with dynamic rectangles showing the price range and a midpoint level line to help traders quickly locate the gap's central price zone. Colors and line styles change to reflect the gap's active or mitigated status.
Traders can use this tool to visualize market inefficiencies, receive early warnings of trend reversals, and identify precise entry and exit points. Risk management features include color-coded gap states, tracking of gap mitigation when price returns to the gap zone, and customizable color settings. The indicator supports practical strategies such as using gap detection for trend continuation signals and combining it with other indicators for decision-making. Stop-loss placement near gap boundaries and monitoring gap mitigation for trend reversal are also supported.
Отзывы покупателей
5 | 100 % | |
4 | 0 % | |
3 | 0 % | |
2 | 0 % | |
1 | 0 % |


![Логотип продукта "High-Low Divergence [Iridio Capital]"](https://cdn.ctrader.com/image/webp/443c4661-7abb-40f1-842f-4b6ec560649b_40914)


