
Deskripsi
📊 TrendHeikinMultiMA – Algoritma Tren Lanjutan
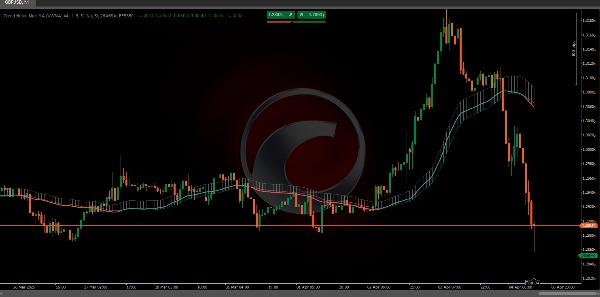
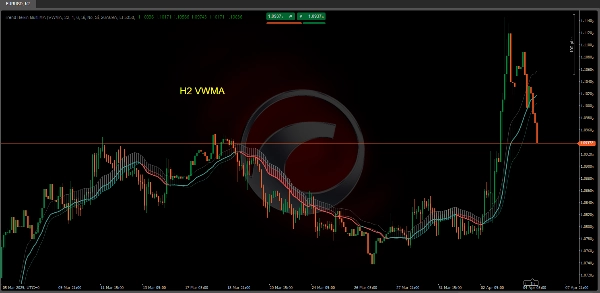
Algoritma TrendHeikinMultiMA dirancang untuk menghitung nilai tren dari data harga, menggunakan formula Heikin-Ashi untuk menghaluskan nilai-nilai ini dan menerapkan berbagai jenis rata-rata bergerak (ALMA, HMA, SMA, SWMA, VWMA, WMA, ZLEMA, atau EMA).
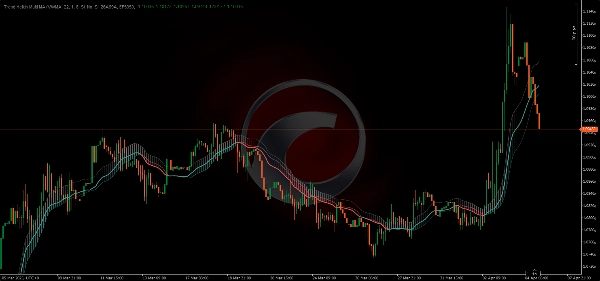
Meskipun nilai Heikin-Ashi digunakan secara internal, grafik tidak menampilkan lilin Heikin-Ashi tradisional. Sebagai gantinya, grafik menggambar garis tren berdasarkan nilai yang telah dihaluskan, membuat arah pasar lebih mudah diinterpretasikan tanpa kompleksitas visual dari grafik lilin.
🔄 1. Peran Penghalusan
Karena nilai tren berasal dari penghalusan Heikin-Ashi yang dikombinasikan dengan rata-rata bergerak, perubahan warna dalam TrendHeikinMultiMA tidak terjadi secara langsung saat harga melintasi garis tren:
- 🔹 Harga mungkin sementara bergerak di atas atau di bawah garis tren tanpa memicu perubahan warna.
- 🔹 Ini terjadi karena indikator menunggu perbedaan yang signifikan dan berkelanjutan antara nilai open dan close yang dihaluskan untuk mengonfirmasi pembalikan tren yang sebenarnya.
✅ Keuntungan dalam Interpretasi
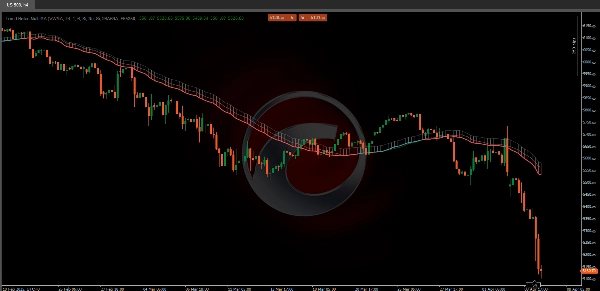
Penundaan yang disengaja dalam perubahan warna ini membantu menghindari sinyal palsu. Dalam grafik lilin tradisional, harga mungkin sebentar melintasi garis tren dan memicu sinyal prematur.
- 🟥 Misalnya, meskipun harga saat ini berada di atas garis tren bearish, indikator akan tetap merah (bearish) sampai nilai yang dihaluskan mengonfirmasi bahwa close secara konsisten lebih tinggi dari open.
- 🟩 Demikian pula, untuk beralih ke hijau (bullish), rata-rata bergerak berbasis Heikin-Ashi harus mengonfirmasi bahwa close secara konsisten melebihi open.
📈 2. Menerapkan Rata-Rata Bergerak pada Nilai Heikin-Ashi
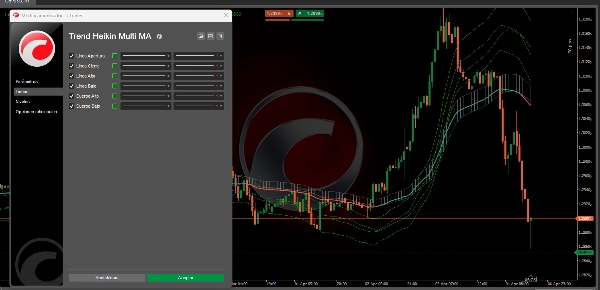
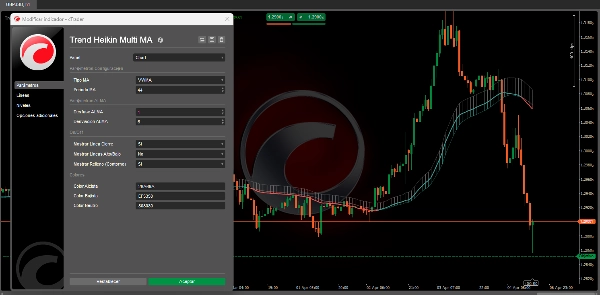
- 🔄 Pemilihan Rata-Rata Bergerak:
-
- Pengguna dapat memilih antara berbagai jenis rata-rata bergerak (ALMA, HMA, SMA, SWMA, VWMA, WMA, ZLEMA, dan EMA).
- Setiap jenis MA menerapkan metode matematis khusus untuk memberi bobot dan menghaluskan nilai historis dari open, close, high, dan low yang berasal dari Heikin-Ashi.
🏆 3. Keuntungan Menggunakan TrendHeikinMultiMA dibandingkan Lilin Tradisional
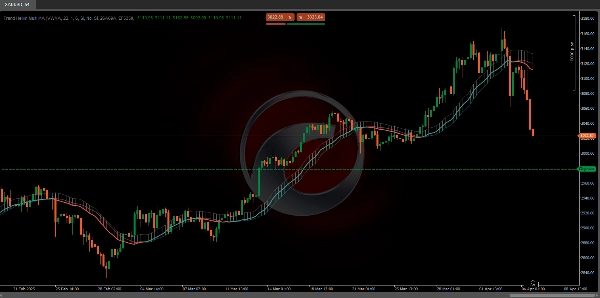
- 📉 Pengurangan Kebisingan:
-
- Lilin tradisional sering menampilkan volatilitas tinggi dan data tersebar, membuat lebih sulit mengidentifikasi tren keseluruhan.
- TrendHeikinMultiMA menghaluskan data ini, menyaring fluktuasi kecil dan menghilangkan ayunan tiba-tiba, memungkinkan trader fokus pada arah pasar utama.
✅ Kesimpulan
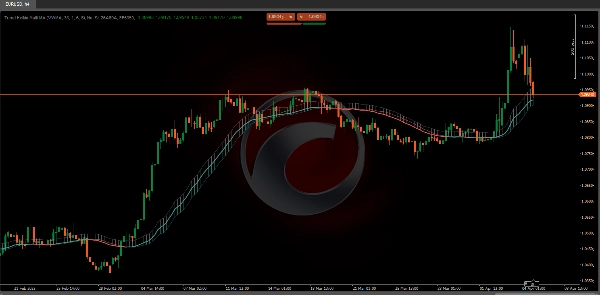
Singkatnya, TrendHeikinMultiMA mengonfirmasi perubahan tren (bullish atau bearish) hanya ketika nilai open dan close yang dihaluskan—dihitung dari Heikin-Ashi dan diproses melalui rata-rata bergerak yang dipilih—secara konsisten menunjukkan bahwa perilaku pasar telah membalikkan arahnya.
Ini memastikan bahwa sinyal lebih dapat diandalkan dan kurang dipengaruhi oleh kebisingan yang terlihat pada grafik lilin tradisional. 🚀📊
🔥 Indikator Toko Pinescritlabs Ctrader 🔥
Dynamic Market Structure
Analysis of Turning Points
Fibonacci Linear
Regression Multi-timeframe
Multi-Level Candle Bias
Tracker
Auto Support and
Resistance Trend Lines
All Support and
Resistance Levels
Ringkasan
The indicator incorporates a smoothing mechanism that delays color changes to confirm trend reversals only after a significant and sustained difference between smoothed open and close values is detected. This approach reduces false signals caused by brief price fluctuations crossing trend lines.
Users can select from multiple moving average types, each applying distinct mathematical weighting methods to the Heikin-Ashi-derived open, close, high, and low values, enhancing customization and adaptability to different trading styles.
Compared to traditional candlestick charts, Trend Heikin Multi MA filters out minor price fluctuations and abrupt swings, allowing traders to focus on primary market trends with more reliable signals. It confirms bullish or bearish trend changes only when smoothed values consistently indicate a market direction reversal, improving signal accuracy and reducing noise.
Ulasan pelanggan
5 | 33 % | |
4 | 67 % | |
3 | 0 % | |
2 | 0 % | |
1 | 0 % |


