
Half Trend BT
Индикатор
36 покупки
Версия 1.0, Mar 2025
Windows, Mac
4.3
Отзывы: 3
Описание
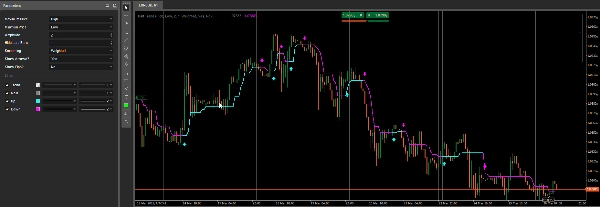
Индикатор Half Trend предназначен для обнаружения и выделения потенциальных разворотов тренда путем сравнения последних максимумов и минимумов за указанный период, а затем построения линии «Вверх» или «Вниз» соответственно. При необходимости он рисует стрелки при каждом изменении тренда и может отображать разницу в пунктах между сигналами.
- Выбор серии максимумов/минимумов
- Индикатор использует две ценовые серии (по умолчанию High и Low) для отслеживания локальных максимумов и минимумов.
- Вы можете выбрать разные типы цен (например,
Open,Close,Medianи т.д.) для каждой серии через Maximum Price и Minimum Price.
- Скользящие средние и расчет периода
- К обеим выбранным ценовым сериям «high» и «low» применяется скользящая средняя (основанная на выбранном типе Smoothing и периоде Amplitude).
- Индикатор сравнивает текущие цены бара с этими сглаженными уровнями high/low, чтобы решить, переключаться ли с восходящего тренда на нисходящий (или наоборот).
- Обнаружение тренда и построение графика
- Если индикатор определяет восходящий тренд, он строит линию Up (голубая) и устанавливает
Trendв значение+1. - Если он обнаруживает нисходящий тренд, он строит линию Down (пурпурная) и устанавливает
Trendв значение-1. - Основной Main выход (серый) обновляется внутренне, чтобы отражать текущие уровни поддержки/сопротивления.
Trend— это невидимая выходная серия, которая численно хранит направление тренда (+1или-1).
- Если индикатор определяет восходящий тренд, он строит линию Up (голубая) и устанавливает
- Стрелки и расчет пунктов
- Показывать стрелки? – Если включено, индикатор рисует стрелку на каждом новом баре, где обнаружен разворот тренда.
- Показывать пункты? – Если включено, он вычисляет и отображает разницу в пунктах между последним сигналом и новым сигналом, рисуя небольшой ярлык и трендовую линию на графике.
Сводка
ИИ-сводка
The Half Trend BT indicator detects potential trend reversals by analyzing recent highs and lows over a specified period. It compares two selected price series—typically High and Low, but configurable to other price types such as Open, Close, or Median—using moving averages based on chosen smoothing methods and amplitude periods. The indicator plots an "Up" line (cyan) when an uptrend is detected and a "Down" line (magenta) for a downtrend, while internally storing trend direction numerically (+1 or -1). A main output line (gray) reflects current support and resistance levels. Optional features include drawing arrows on bars where trend reversals occur and calculating pip differences between signals, which are displayed as labels and trendlines on the chart. This indicator supports multiple markets including Forex, indices, commodities, cryptocurrencies, and stocks.
Профиль индикатора
Отзывы покупателей
4.3
Отзывы: 3
5 | 33 % | |
4 | 67 % | |
3 | 0 % | |
2 | 0 % | |
1 | 0 % |
Отзывы покупателей
March 29, 2025
Clean idea for traders around chart reading. The useful part is adding confirmation before a trade, with the numbers checked before scaling. The cleaner reads should hold across 3 sessions, not just 1 good chart. It is stronger when a 1.5R target is realistic before the entry.
March 28, 2025
March 28, 2025
Decent tool for testing if the trader wants it makes market context easier to scan. It works best as support, not a final decision maker. I would test it on 2 timeframes, 20 signals and a 1R stop plan. it should not be used as a blind entry trigger.
Обсуждение
Частые вопросы
Prop
Forex
Signal
Indices
Commodities
Crypto
Stocks
Продукты, доступные в cTrader Store, включая торговых ботов, индикаторы и плагины, предоставляются сторонними разработчиками и доступны исключительно в информационных и технических целях. cTrader Store не является брокером и не предоставляет инвестиционные консультации, персональные рекомендации или какие-либо гарантии будущей доходности.


![Логотип продукта "Gaussian Channel [Iridio Capital]"](https://cdn.ctrader.com/image/webp/7c039209-5573-4a54-a072-f9528b503103_41960)


Цена
46
Продажи
1.02K
Бесплатные установки