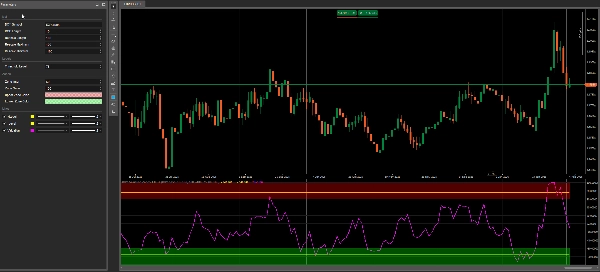
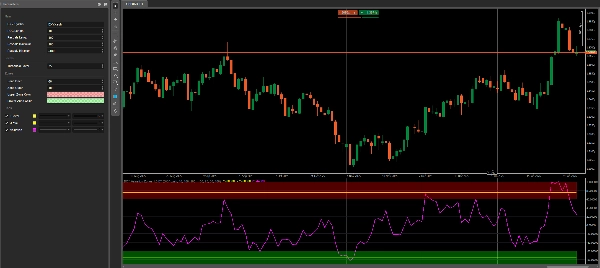
DXY Valuation Zones 1.0 BT
Индикатор
Version 1.0, Feb 2026
Windows, Mac
Загруженное изображение продукта "DXY Valuation Zones 1.0 BT"Загруженное изображение продукта "DXY Valuation Zones 1.0 BT"
18
Продажи
461
Бесплатные установки
О пробной версии
14 Days Trial

DXY Valuation Zones 1.0 BT shows a clean DXY-relative valuation line for your chart symbol and highlights two simple context areas: an Over Zone and an Under Zone.
It’s built as a Daily (D1) context filter — no clutter, just clear zones + a configurable ±Threshold level.

All zone colors use the native cTrader color picker, so you can control transparency directly via the opacity slider inside the palette.

Recommended Use (Best on Daily)

This indicator works best on USD-related pairs, because DXY represents broad USD strength.

Examples:

  • XXXUSD: EURUSD, GBPUSD, AUDUSD, NZDUSD
  • USDXXX: USDJPY, USDCAD, USDCHF

Quick Start (recommended defaults)

  • Timeframe: Daily (D1)
  • Over Zone: +70 … +100
  • Under Zone: -70 … -100
  • Threshold: ±75 (adjustable)
  • DXY Symbol: DXY.cash (or your broker’s DXY name)


How it works (simple)

  1. Calculates ROC (percent change) for your chart symbol
  2. Calculates the same ROC for DXY
  3. Uses the difference (Symbol ROC – DXY ROC)
  4. Rescales the result into a stable -100 … +100 range


How to read it

  • Valuation > +Threshold → stretched / “Over” context
  • Valuation < -Threshold → stretched / “Under” context
  • In-between → neutral context

Use it as a bias & location filter, not as a standalone entry signal.


Important (Broker requirement)

This indicator requires a broker-provided DXY symbol (example: DXY.cash).
Tested on FTMO (availability and naming may vary by broker feed).
If your broker uses a different name, just change the DXY Symbol pa

0.0
Отзывы: 0
Отзывы покупателей
У этого продукта еще нет отзывов. Уже попробовали его? Поделитесь впечатлениями!
Prop
Forex
Signal

Больше от этого автора

Высокий рейтинг
Бесплатно
Market Session BT
Market Session BT
Индикатор
Indices
Prop
Commodities
+4
Half Trend BT
Half Trend BT by BullittTraders
Индикатор
Indices
Prop
Commodities
+3
Camarilla 1.5 BT
Camarilla by Bullitt Traders — a precise, non-repainting pivot indicator for cTrader.
Индикатор
Indices
Prop
Commodities
+3
HMA MTF 2.0
HMA MTF 2.0 (Multi-Timeframe )
Индикатор
Indices
Prop
Stocks
+3
Bar Time
Bar Time Timeframe / Renko
Индикатор
Indices
Breakout
Prop
+2
Price Change Bundle 1.0 BT
Price Change Bundle 3-in-1 Levels • Bars • Histogram. Secret of Price Change
Индикатор
NAS100
NZDUSD
Indices
+9
Belkhayate PRC BT
Belkhayate PRC (Polynomial Regression Channel)
Индикатор
Indices
Breakout
Prop
+6
Price Level DWM BT
Price Level DWM BT
Индикатор
NAS100
NZDUSD
XAUUSD
+11
Half Trend Cloud BT
Half Trend Cloud

Вам также может понравиться

Популярный
$ 50
Volume Edge Pro
Pro Volume Profile with Delta, Session Filters & CSV Export. Precision order flow analysis.
Индикатор
NAS100
NZDUSD
XAUUSD
+12
WT - Hawkes Process
Identifies market compression zones and explosive Breakout moments using mathematical modeling.
Индикатор
NAS100
NZDUSD
Breakout
+13
SupportResistance
Auto-detect support and resistance & trendlines, highlight pullbacks/BOS retests, and filter with candle confirmation.
zh-cn Variety Period time panel(multilanguage)
This indicator can be used to: change color, shape size, position, change font, increase or decrease, and other function
Индикатор
XAUUSD
Commodities
ATR
+1
[Stellar Strategies] Visual Trend Momentum
Visual Trend Momentum is a MA/ATR/Volume trend tool. Visual signals for strong trends & reversals. Customizable. 📈📉
Индикатор
Indices
XAUUSD
Forex
Heatmap
heatmap
Supply Demand - BasicV1
Supply and demand zones. They're important. Here's a free version to get you started!
Morning Star On Chart
Morning Star pattern on chart (Bullish and Bearish) automatically marked with (BUY & SELL) Very powerful signals.
Индикатор
NAS100
NZDUSD
Martingale
+26
DIGITAL IMPLEMENTATION SYSTEM
LudwigICT – Digital Root & IDR (cTrader Automate)
Индикатор
RSI
Indices
ATR
+3
Divergency 1.1_withSourceCode
🔍 Divergence Indicator for cTrader (Update v1.1)
Kaufman Adaptive MA with Trend Vision
Adaptive KAMA: fast in trend, slow in noise — with color-coded market state visualization.
IR Multi Data
show symbol and time fram, daily net profit percent, daily net profit, and spread ln your chart. consider that timezone
18
Продажи
461
Бесплатные установки