Описание
Belkhayate PRC (Полиномиальный регрессионный канал)
1 кривая. 3 полосы отклонения. Чистая структура.
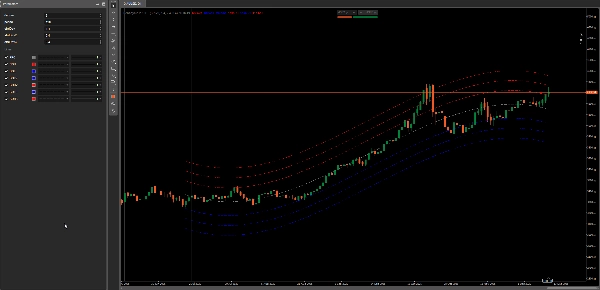
Belkhayate PRC — это Полиномиальный регрессионный канал с 3 конвертами стандартного отклонения.
Он помогает вам легко определить зоны среднего значения, расширения и истощения: цена склонна колебаться вокруг гладкой регрессионной кривой — и внешние полосы часто выступают в роли практических зон реакции.
Этот релиз бесплатный, потому что я хочу, чтобы каждый трейдер мог его протестировать, понять и решить, подходит ли он для их рабочего процесса.
Что он делает
Полиномиальная регрессионная кривая (PRC)
- Подгоняет гладкую регрессионную кривую к последним N барам (ваш Период).
- Степень 1–4: от мягкого сглаживания до более сильной кривизны.
Полосы отклонения (3 уровня)
- 3 конверта, основанные на ошибке регрессии (стандартное отклонение).
- Полезны как «зоны» для откатов, экстремумов и условий возврата к среднему.
Почему это полезно
- Ясность тренда без запаздывающего наложения скользящих средних
PRC дает вам чистый «центр тяжести» за последний Период. - Структурированные экстремумы
Полосы помогают оценить, когда цена растянута, а когда возвращается в нормальную зону. - Отлично для контекста и исполнения
Используйте более высокий таймфрейм для направления/контекста и более низкий для входов в зоны кривой или полос.
История / откуда взялась идея
Этот инструмент вдохновлен классической концепцией регрессионных каналов, используемых в техническом анализе (подгонка линии/кривой регрессии к цене и построение конвертов на основе отклонения).
Название «Belkhayate» обычно ассоциируется с популяризированной версией этого канала в стиле PRC, распространенной в трейдинговых сообществах.
Моя реализация для cTrader — это чистая переработка, ориентированная на стабильность, настройки и практическую применимость на современных графиках.
Рекомендуемое использование
- Трендовый рынок: торгуйте откаты к PRC, управляйте риском с помощью ближайшей полосы
- Рынок в диапазоне: торгуйте экстремумы (полоса 2 / полоса 3) обратно к PRC
- Проверка волатильности: расширяющиеся полосы = растущая волатильность / ускорение
Сводка
This indicator helps traders identify mean zones, expansion phases, and exhaustion points by showing how price oscillates around the regression curve, with outer bands often acting as reaction areas. It is applicable across various markets including Forex, indices, commodities, stocks, and cryptocurrencies, supporting symbols like BTCUSD, EURUSD, GBPUSD, XAUUSD, NAS100, and USDJPY.
Recommended uses include trading pullbacks toward the PRC in trending markets, fading extremes in ranging markets, and monitoring volatility through band width changes. The tool is designed for clarity and practical usability on modern charts, suitable for combining higher timeframes for context with lower timeframes for execution.
Отзывы покупателей
5 | 100 % | |
4 | 0 % | |
3 | 0 % | |
2 | 0 % | |
1 | 0 % |