
Price Level DWM BT
Индикатор
Версия 1.0, Dec 2025
Windows, Mac
4.7
Отзывы: 4
Описание
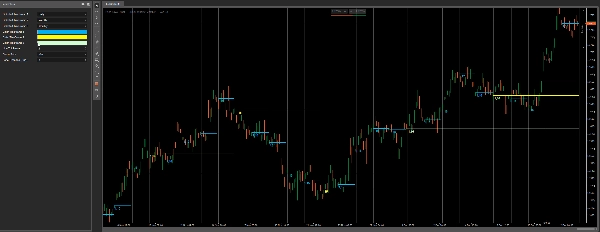
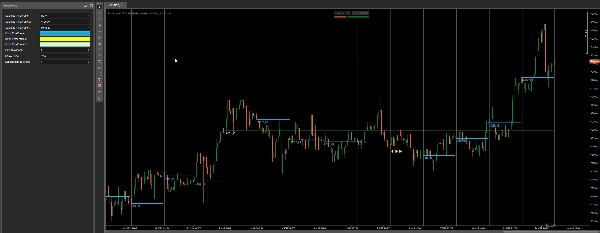
Уровень цены DWM от Bullitt Traders
Уровень цены DWM Ежедневные, еженедельные и ежемесячные уровни изменения цены отображаются чисто, уровни ссылок более высокого таймфрейма наносятся прямо на ваш график — так вы всегда знаете, где находится цена относительно ключевых ежедневных, еженедельных и ежемесячных ориентиров.
Эти уровни широко используются для:
- контекста направления и предвзятости
- внутридневных реакций поддержки/сопротивления
- решений о возврате к среднему или продолжении тренда
- «торговли по расположению» (где цена торгуется относительно более высокого таймфрейма)
Держите ваш график минималистичным, быстрым и читаемым, при этом сохраняя контекст HTF в поле зрения.
Что вы получаете
- До 3 уровней ссылок более высокого таймфрейма одновременно
- Ежедневные / еженедельные / ежемесячные выбираются через выпадающее меню
- Отдельные цвета для каждого таймфрейма
- Регулируемая толщина
- Опциональная метка цены (чистая и ненавязчивая)
Ключевые особенности
- Минималистичное нанесение уровней HTF (разработано для чистых графиков)
- Нерисующиеся уровни ссылок (основаны на завершенных данных HTF)
- Отлично работает с сессиями, зонами спроса и предложения, структурой рынка, инструментами ICT и другими
- Подходит для FX, индексов, золота — любого рынка
Настройки
- Выберите Таймфрейм 1 / 2 / 3
- Цвет для каждого таймфрейма
- Толщина линии
- Показать метку цены (вкл/выкл)
- Расстояние метки (визуальный сдвиг)
Примечания
- Использует завершенные данные более высокого таймфрейма для поддержания стабильности и согласованности уровней.
Сводка
Профиль индикатора
Категория индикатора
Волатильность
Тип вывода
Сигналы
Требования к данным
Внешние данные
Поддерживаемые сигналы
Прорыв уровня
Отзывы покупателей
4.7
Отзывы: 4
5 | 75 % | |
4 | 25 % | |
3 | 0 % | |
2 | 0 % | |
1 | 0 % |
Отзывы покупателей
February 9, 2026
Price Level DWM BT provides clean and accurate daily, weekly and monthly levels. Best used from M5 and higher timeframes, where levels stay readable and meaningful. A great context tool for intraday and swing traders who rely on higher-TF structure, reactions and trade planning.
December 18, 2025
The setup needs less second guessing, but overconfidence is the real danger.
December 15, 2025
pretty fine as one more layer, especially in mixed charts. A few signals across sessions tell more.
Обсуждение
Частые вопросы
Prop
Forex
Signal
Breakout
Scalping
Commodities
Crypto
Продукты, доступные в cTrader Store, включая торговых ботов, индикаторы и плагины, предоставляются сторонними разработчиками и доступны исключительно в информационных и технических целях. cTrader Store не является брокером и не предоставляет инвестиционные консультации, персональные рекомендации или какие-либо гарантии будущей доходности.


![Логотип продукта "High-Low Divergence [Iridio Capital]"](https://cdn.ctrader.com/image/webp/443c4661-7abb-40f1-842f-4b6ec560649b_40914)


Цена
48
Продажи
1.05K
Бесплатные установки