
Price Change Bundle 1.0 BT
Indicador
2 compras
Versión 1.0, Aug 2025
Windows, Mac
4.0
Valoraciones: 1
Descripción
Paquete de Cambio de Precio — 3 indicadores, 1 lógica.
Las herramientas de mi propia configuración (Oferta y Demanda + ZigZag personalizado). Construidas para mostrar cómo se mueve realmente el precio alrededor de los cierres de TF superiores.
Activa o desactiva cualquier módulo — habilita/deshabilita Niveles, Barras, Histograma individualmente.
Módulos
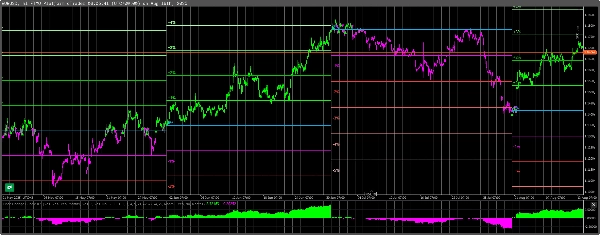
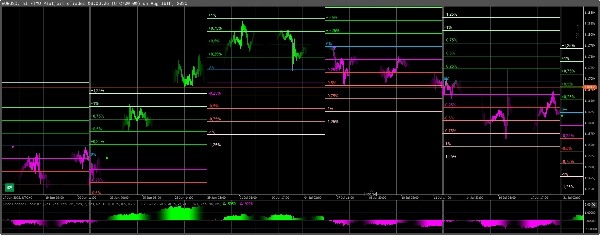
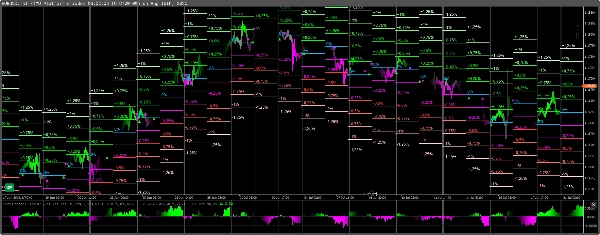
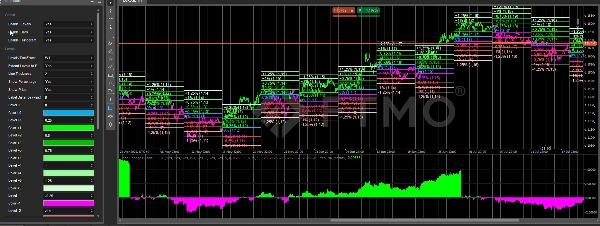
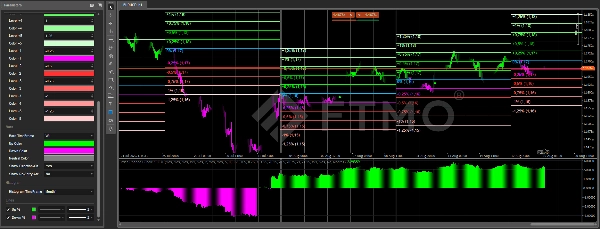
Niveles de Cambio de Precio
- Dibuja zonas porcentuales (±0.25…±1.25%) en el marco temporal seleccionado.
- Cada zona se mide desde la línea base 0% y muestra % y precio.
- Opción para extender las líneas hasta el final del período para mapas semanales/mensuales limpios.
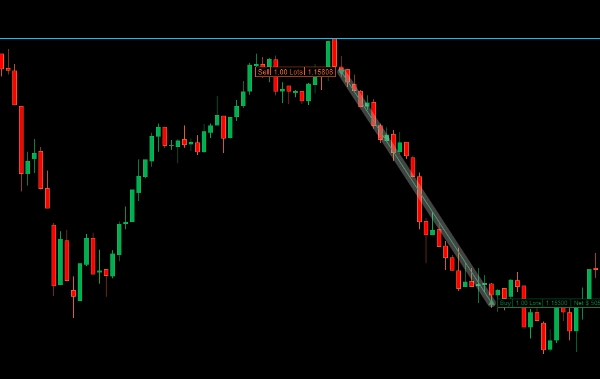
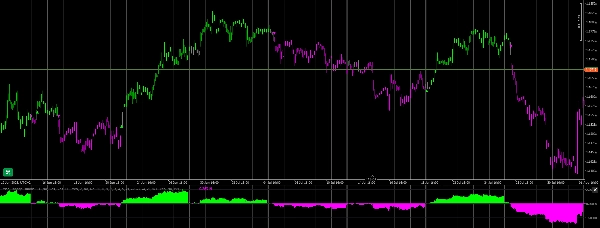
Barras de Cambio de Precio
- Colorea velas según el régimen Completo Por Encima/Por Debajo frente al pivote del TF.
- Mejor usado en el cierre de barra para entradas y una lectura rápida del régimen.
- Incluye flechas de Cambio de Dirección y Reentrada (después de neutral → mismo lado).
Histograma de Cambio de Precio
- Muestra el desarrollo porcentual general frente a la misma referencia de TF (Up% / Down%).
- Ideal para detectar aceleraciones/desaceleraciones de un vistazo.
Por qué funciona — “Secretos del Movimiento del Precio”
- Los profesionales se anclan a cierres previos de TF superiores (MN/W1/D1).
- Las distancias porcentuales medidas desde ese ancla actúan como imanes/objetivos prácticos.
- Una vela completamente por encima/por debajo del pivote define el régimen; la reentrada después de neutral a menudo continúa el movimiento.
Uso flexible
- Elige cualquier marco temporal por módulo (por ejemplo, Niveles MN • Barras W1 • Histograma D1).
- Funciona en cualquier tipo de gráfico, incl. Renko/rango/tick (los cálculos usan tus TFs basados en tiempo seleccionados).
- Sin repintado. Ligero.
Video y Soporte
- Un video paso a paso (instalación, preajustes, ejemplos de trading) será publicado pronto.
- Los compradores pueden contactarme directamente para cualquier pregunta, ayuda con la configuración o comentarios. Respondo personalmente.
Resumen
Resumen de IA
Price Change Bundle 1.0 BT is a composite indicator consisting of three modules—Levels, Bars, and Histogram—designed to analyze price movements relative to higher timeframe closes. It integrates concepts from Supply & Demand and a custom ZigZag to reveal how price behaves around significant reference points.
- Price Change Levels: Displays percentage zones (±0.25% to ±1.25%) from a 0% baseline within a selected timeframe, showing both percentage and price values. Lines can be extended to the period’s end for clear weekly or monthly mapping.
- Price Change Bars: Colors candles based on their position relative to the timeframe pivot, indicating regimes with full above/below coloring. Includes arrows signaling direction changes and re-entries after neutral phases, aiding entry decisions.
- Price Change Histogram: Illustrates overall percentage development (Up%/Down%) against the same timeframe reference, facilitating quick identification of acceleration or slowdowns.
Each module can be toggled on or off independently and configured with different timeframes. The indicator works on any chart type, including Renko, range, and tick charts, using time-based timeframe calculations. It anchors calculations to previous closes of higher timeframes (monthly, weekly, daily) and does not repaint. Buyers have access to direct support from the developer.
Perfil del indicador
Valoraciones de clientes
4.0
Valoraciones: 1
5 | 0 % | |
4 | 100 % | |
3 | 0 % | |
2 | 0 % | |
1 | 0 % |
Valoraciones de clientes
February 9, 2026
Price Change Bundle 1.0 BT delivers clear and practical price-change metrics. Best used on M10-H1, where momentum readings stay balanced and meaningful. Great for filtering weak moves, confirming impulse strength and improving intraday timing. A simple but effective companion for momentum-based strategies.
Conversación
Preguntas frecuentes
Prop
Forex
Signal
Breakout
Indices
Los productos disponibles a través de cTrader Store, incluidos bots, indicadores y plugins para operar, son proporcionados por desarrolladores de terceros y están disponibles únicamente con fines informativos y de acceso técnico. cTrader Store no es un bróker, por lo que no proporciona asesoramiento de inversión, recomendaciones personales ni ninguna garantía de rentabilidad futura.


Precio
48
Ventas
1.05K
Instalaciones gratis